Goals
advertisement
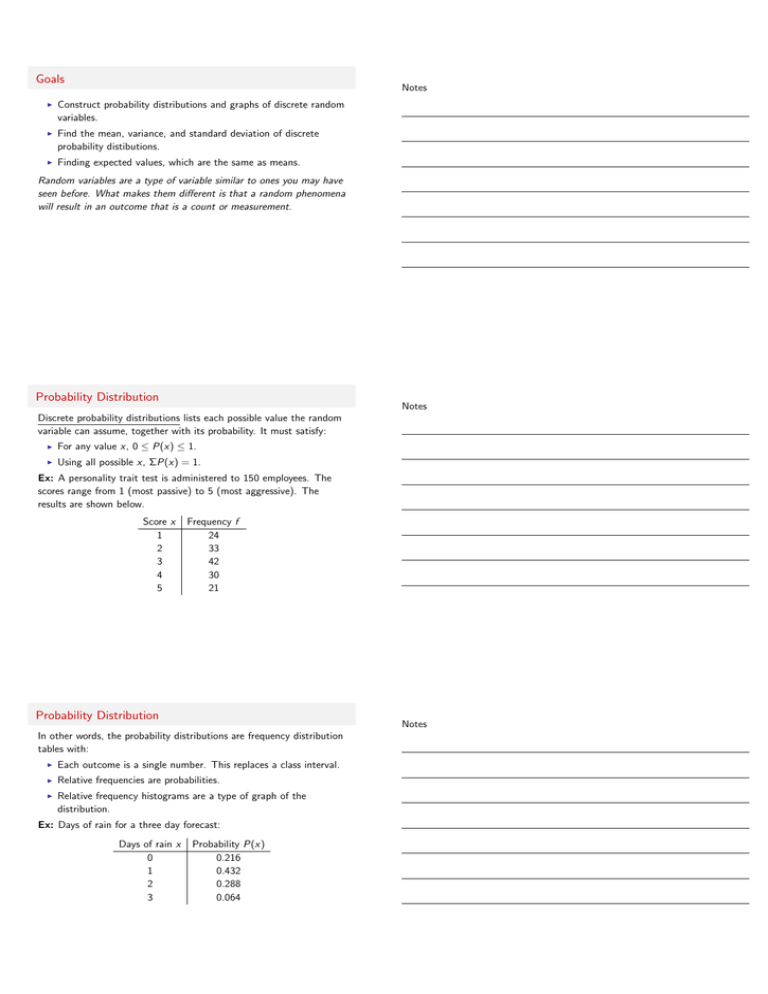
Goals Notes I Construct probability distributions and graphs of discrete random variables. I Find the mean, variance, and standard deviation of discrete probability distibutions. I Finding expected values, which are the same as means. Random variables are a type of variable similar to ones you may have seen before. What makes them different is that a random phenomena will result in an outcome that is a count or measurement. Probability Distribution Notes Discrete probability distributions lists each possible value the random variable can assume, together with its probability. It must satisfy: I For any value x, 0 ≤ P(x) ≤ 1. I Using all possible x, ΣP(x) = 1. Ex: A personality trait test is administered to 150 employees. The scores range from 1 (most passive) to 5 (most aggressive). The results are shown below. Score x 1 2 3 4 5 Frequency f 24 33 42 30 21 Probability Distribution Notes In other words, the probability distributions are frequency distribution tables with: I Each outcome is a single number. This replaces a class interval. I Relative frequencies are probabilities. I Relative frequency histograms are a type of graph of the distribution. Ex: Days of rain for a three day forecast: Days of rain x 0 1 2 3 Probability P(x) 0.216 0.432 0.288 0.064 Ex: Decide whether the distribution is a probability distribution: Notes 1. x 5 P(x) 0.28 2. x P(x) 3. x P(x) 4. x 5 P(x) 0.09 6 0.21 1 2 3 1 2 1 4 5 4 7 0.43 4 −1 1 2 3 4 1 16 5 8 1 4 1 16 6 0.36 8 0.15 7 0.49 8 0.06 The mean of a discrete random variable is given by Notes µ = Σx · P(x) This is from the weighted mean formula, using x as a value the random variable can assume. This is also the same as the expected value of a random variable. Ex: The mean of the personality test is 2.94. What can you conclude? Ex: The mean of the three day forecast is 1.2 What can you conclude? Ex: A company tracks the number of sales new employees make each day during a 100-day period. The results are given below. Find the mean. What can you conclude? Sales per day x Number of days f 0 1 16 19 2 15 3 4 21 9 5 6 7 10 8 2 The variance is given by the formula σ 2 = Σ(x − µ)2 · P(x) The standard deviation is √ p σ = σ 2 = Σ(x − µ)2 · P(x) Ex: The variance and standard deviation for the personality test are 1.616 and 1.3 respectively. How do you interpret these numbers? Ex: A table for the three day forecast is given. Fill in the blanks and find the variance and standard deviation. Remember µ = 1.2 x 0 1 2 3 P(x) x − µ (x − µ)2 0.216 0.432 0.288 0.064 P(x) · (x − µ)2 Notes Expected Value Notes Expected value is the term to used to expect what would happen over a large repetion of trials. I It is the same as the mean, Expected value = E (x) = µ = Σx · P(x) I Although probabilities are never negative, the expected value can be negative. I An expected value of 0 has a practical interpretation in games of chance. What is it? Ex At a raffle, 1500 tickets are sold at $4 each. The prizes are $750, $500, $150, and $100. You buy one ticket. Write a probability distribution for the possible gains (or outcomes). What is your expected value of your gain? Assignment I Notes Homework §4.1: 2, 22, 28, 32, 36, 42, 46, 49, 50 I Reading §4.2 I Study Guide: Chapter Quiz 4: 2, 3 I Extra review: p 227 - 228: 7, 13, 15 Notes
