Studies of MeV F
advertisement

Studies of MeV Fast Protons Produced in Laser Fusion Experiments
D. G. Hicks, C. K. Li, F. H. Seguin, A. K. Ram, and R. D. Petrasso
Plasma Science and Fusion Center, Massachusetts Institute of Technology, Massachusetts 02139
J. M. Soures, D. D. Meyerhofer, S. Roberts, J. D. Schnittman, C. Sorce, and C. Stockl
Laboratory for Laser Energetics, University of Rochester, Rochester, New York 14623
T. C. Sangster and T. W. Phillips
Lawrence Livermore National Laboratory, Livermore, California 94550
(November 24, 1999)
Enhanced laser-induced acceleration of fast protons up to
laser at intensities of 1015 Wcm 2 . These energies are more
than 5 times greater than previously observed on single-beam
experiments at equivalent intensities. The total energy in
these protons is 0:1 % of the laser energy and inferred
hot electron temperatures are 10 { 20 keV. High-resolution
spectroscopy has detected proton spectra with intense, regular
lines.
>
1 MeV has been observed on the 60-beam, 30-kJ OMEGA
A number of experiments have observed that ions at
suprathermal energies are produced during high-intensity
laser interactions with solids [1] { [6]. These experiments
show that protons are always present in the ion signal,
regardless of the type of target material. Such accelerated ions, or fast ions, are thought to be associated with
hot electrons [7] { [9] which produce electrostatic elds
through charge separation.
A distinctive feature of fast proton spectra is the presence of a well-dened, maximum cuto energy. For
single-beam experiments, Tan et al. [1] observed the scaling of maximum proton energy with laser intensity to be:
Emax = 3:51 10 3 (I2 )1=3
(1)
2
14
18
2
2
over the range I = 10 3 10 Wcm m , where
Emax is the maximum proton energy in keV, I is the
laser intensity in Wcm 2 , and is the laser wavelength
in m. More recently, this relationship has been veried at high intensities with substantially dierent laser
conditions [2,6]. At least 3 dierent detector types were
used in all these studies. From this scaling, it would be
expected that, at I2 = 1014 Wcm 2m2 corresponding to conditions on laser fusion experiments, Emax 160 keV. Instead, our studies on the 60-beam OMEGA
laser have measured proton energies greater than 1 MeV.
In addition to observing these unexpectedly high maximum energies, we have also performed high-resolution
measurements of the proton spectra. Previous studies of
the proton spectrum using low-resolution time-of-ight
techniques often showed exponential-like velocity spectra consistent with the isothermal, self-similar plasma-
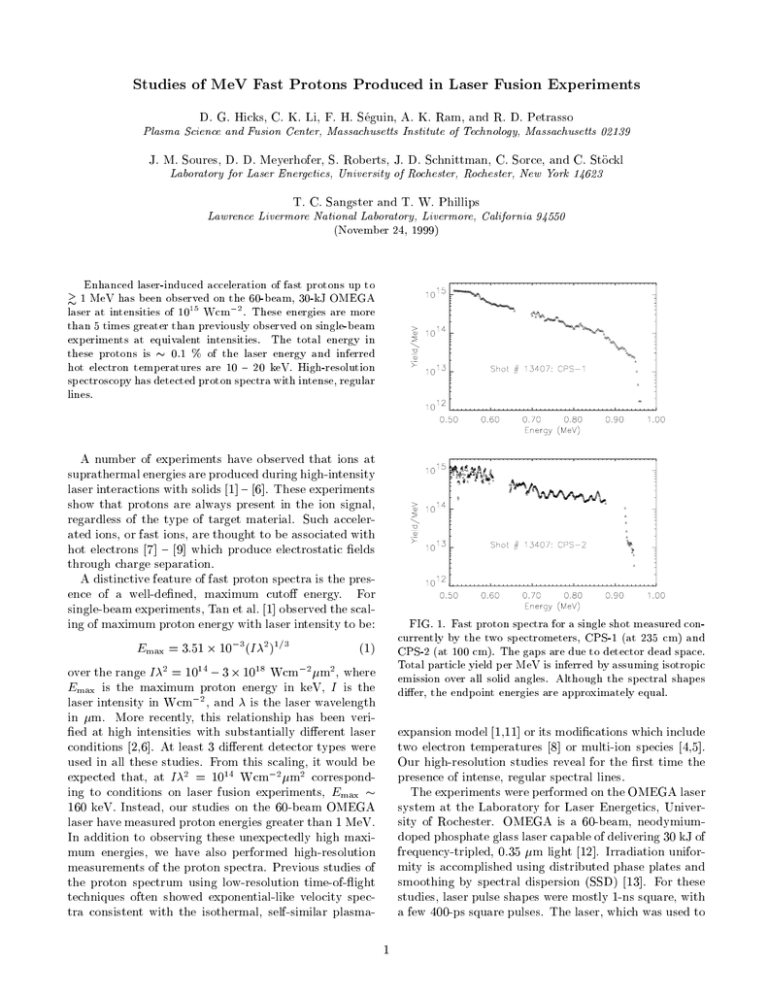
FIG. 1. Fast proton spectra for a single shot measured concurrently by the two spectrometers, CPS-1 (at 235 cm) and
CPS-2 (at 100 cm). The gaps are due to detector dead space.
Total particle yield per MeV is inferred by assuming isotropic
emission over all solid angles. Although the spectral shapes
dier, the endpoint energies are approximately equal.
expansion model [1,11] or its modications which include
two electron temperatures [8] or multi-ion species [4,5].
Our high-resolution studies reveal for the rst time the
presence of intense, regular spectral lines.
The experiments were performed on the OMEGA laser
system at the Laboratory for Laser Energetics, University of Rochester. OMEGA is a 60-beam, neodymiumdoped phosphate glass laser capable of delivering 30 kJ of
frequency-tripled, 0.35 m light [12]. Irradiation uniformity is accomplished using distributed phase plates and
smoothing by spectral dispersion (SSD) [13]. For these
studies, laser pulse shapes were mostly 1-ns square, with
a few 400-ps square pulses. The laser, which was used to
1
FIG. 3. Maximum proton energy versus the hot electron
temperature inferred from the slope of the ion velocity spectrum. Uncertainties in the inferred temperature are caused
by uncertainties in determining the spectral slope. The linear relation is in agreement with that found for single-beam
experiments in Ref. [1].
FIG. 2. Scaling of maximum fast-proton energy with I2 :
open and solid circles are for glass targets with 1 ns and 0.4 ns
pulses respectively, while open and solid triangles are for plastic targets with 1 ns and 0.4 ns pulses respectively. Error bars,
at less than 2 %, are smaller than the plotting symbols. The
dashed line is extrapolated from the scaling of single-beam experiments (Eq. 1), while the dotted line is from experiments
using 8-beams [1]. There is no signicant dierence between
shots with or without SSD.
error between instruments is < 40 keV).
The measurements of maximum proton energy are
plotted versus I2 in Fig. 2. The scaling found previously
on single-beam and 8-beam experiments [1] are shown by
the dashed and dotted lines respectively. For intensities
less than 1.61014 Wcm 2, the proton energies are below the
detectable limit of 100 keV, while at intensities
of 1015 Wcm 2 energies up to 1.4 MeV were observed.
Neither laser-pulse duration (at 0.4 or 1 ns) nor application of SSD appear to make any substantial dierence to
the maximum proton energies; however, as Fig. 2 shows,
maximum energies are generally higher for CH targets
than they they are for glass targets.
As illustrated in Fig. 2, the measured proton energies
of 1 MeV are more than 5 times greater than those
observed previously at the same I2 [1]. In order to
place the OMEGA measurements in context, it is useful
to examine more closely some of these previous studies.
The relationship given by Eq. 1 (dashed line in Fig. 2)
was determined by studies over 4 orders of magnitude
in intensity using nanosecond pulses of 10.6 m light at
energies up to 1 kJ focused to spot sizes of 100 m [1].
A similar scaling was found using picosecond pulses of
1.05 m light at low energy (30 J) focused to spot sizes
of 12 m [2]. Despite the substantially dierent laser
conditions of these two studies, there was no indication
of any signicant deviation from the scaling given by Eq.
1, at least for the range of conditions covered by these
single-beam experiments. On the other hand, for experiments using 8 beams, a stronger scaling with I2
directly illuminate the target, delivered energies of 10 to
30 kJ. Laser intensities varied from 1014 to 1015 Wcm 2,
where the intensity is calculated by dividing total incident laser energy by pulse length and target surface area.
Targets were 0.9 { 1 mm diameter spherical microballons
with glass or paralene (CH) shell material ranging from
2 to 20 m in thickness.
Proton spectra were observed using a charged-particle
spectrometer [14] consisting of a 7.6-kG permanent magnet with CR-39 nuclear track-etch detectors. The in-7
strument can measure total particle yields between 10
and 1016 and proton energies from 0.1 to 40 MeV. Use
of a high-eld magnet in conjunction with single-particle
discrimination from track detectors gives this instrument
high energy resolution: better than 1 % over the energy
range for fast ions, or < 3 keV at 500 keV. Systematic
uncertainties are < 2%. A rapid, automated scanning
system was developed which can readily count 106 tracks
per shot. Simultaneous measurements are made by two
virtually identical spectrometers positioned 101Æ apart,
one outside the OMEGA chamber at 235 cm from the
target (CPS-1), the other inside at 100 cm (CPS-2).
Sample spectra obtained simultaneously by each spectrometer are illustrated in Fig. 1, clearly showing the
characteristic maximum cuto energy [15]. Despite different spectral shapes, the endpoint energies observed
from both views are approximately equal and generally
are within 50 keV of each other (where the systematic
2
was observed (dotted line in Fig. 2) [1,10]. It is notable
that these multi-beam experiments found that maximum
proton energies were dependent on the target material
whereas the single-beam experiments observed no such
dependency. On the 60-beam OMEGA
laser, we observe
an even stronger scaling with I2 than observed on the
8-beam studies and we nd that glass and CH targets
lead to dierent maximum proton energies. This evidence would appear to suggest that the presence of many
beams on OMEGA might be the cause of these elevated
proton energies. However, it should be emphasized that
laser conditions on OMEGA are unique in many other
ways besides the presence of 60 beams and, without performing a systematic study, it is diÆcult to isolate any
single factor that might be responsible for producing the
elevated proton energies.
Since fast ions are generally thought to be associated
with hot electrons driving the plasma expansion into vacuum [7{9], it is useful to infer an eective hot electron
temperature from the proton spectra. To do this requires that a model be used to describe the plasma expansion. One such description is the isothermal, self-similar
model [7] which predicts that the slope of the velocity
spectrum is a function of the hot electron temperature,
Th . For our studies, the spectra do not always have a
single, well-dened slope; however their character is generally exponential-like and by a least-squares t to the
velocity spectra (avoiding the steep endpoint region), the
average slope and thus an eective temperature can be
determined. In Fig. 3 it is shown that the maximum proton energy is proportional to the inferred Th, with a best
t giving the relationship Emax=Th = 55. This value
is close to that found experimentally by Tan et al. [1]
where Emax=Th = 66, though, to the best of our knowledge, there is no theoretical explanation for this constant
ratio. We thus infer that the elevated proton energies are
driven by eective hot electron temperatures of 10 { 20
keV.
Measurements of hard x-rays made in conjunction with
these experiments indicate the presence of superhot electron distributions with temperatures between 50 { 250
keV at intensities of 1015 Wcm 2. The x-ray signal is a strongly increasing function of laser intensity in
the range 5 { 91014 Wcm 2 and is slightly reduced by
application of SSD. It appears that such superhot electrons are associated with the two-plasmon decay instability [16]. This discrepancy between the proton-inferred
and x-ray-inferred hot electron temperatures is not without precedence. Tan et al. [1] found that these two types
of measurement generally agreed for temperatures below
10 keV but disagreed for higher temperatures, with the
x-ray inferred values being a factor of approximately 3
times greater. One possible reason for this discrepancy
is that the hot-electron temperature is evolving over the
duration of the pulse and the x-ray and proton methods
are sensitive to dierent periods of this time evolution.
FIG. 4. Fraction of incident laser energy converted to fast
protons with energies greater than 0.2 MeV plotted as a function of the endpoint energy. Plotting symbols are as in Fig.
2. Vertical bars on some data points represent the dierences
between the two spectrometers.
In particular, the ion acceleration is greatest early in the
laser pulse when the highest ion densities give rise to the
highest space-charge elds [7]. This implies that the proton spectra would weight more heavily the hot electron
temperatures existing at early time periods. Understanding the origin of this temperature discrepancy may allow
the two types of measurement to be used in a complementary fashion to understand the complex hot-electron
distribution.
In Fig. 4, the fraction of laser energy converted to fast
protons with energies greater than 200 keV is plotted
versus spectral endpoint. At intensities of 1015 Wcm 2,
corresponding to an endpoint of 1 MeV, the total energy carried by the the fast protons is 10 3 of the
laser energy, similar to the total energy of the superhot
electrons inferred from x-ray data. Plastic targets, which
usually produce higher maximum proton energies than
glass targets irradiated at the same laser intensity, have
correspondingly higher total ion energies. To within the
scatter of the data, protons from the 0.4 ns shots have approximately the same fractional energy as those from the
1 ns shots. This correlation between the energy fraction
and the maximum energy, regardless of target material or
pulse length, indicates that the maximum proton energy
can be used as a rough measure of the total energy in the
fast protons. It is noteworthy that, on previous singlebeam experiments
[6] at higher intensities of I2 1017
2
Wcm where the maximum proton energy was also close
to 1 MeV, the fraction of laser energy carried by the fast
ion was also 10 3.
Also shown in Fig. 1 is a spectrum with oscillations,
3
FIG. 5. Occasionally, the proton spectra exhibit discrete,
regularly-spaced lines whose spacing increases with energy.
These lines are super-imposed upon the exponential-like background.
FIG. 6. A plot of the velocity dierence, V , between adjacent lines in Fig. 5 versus their average velocity, V . The
observed linear relationship is expected if the lines are treated
as the density peaks of an ion acoustic wave in the expanding
plasma.
features that are not repeatable from one shot to the
next, and not necessarily observed on both spectrometers. Occasionally, the oscillations take the form of intense lines, as shown in Fig. 5, though it is unclear at
this stage what specic conditions give rise to them. The
spacing between adjacent lines increases towards higher
energies, a characteristic that is common to all such line
spectra. For a given laser intensity, spectra with or without lines do not show any signicant dierence in maximum energy.
Such strong spectral lines have not been observed before and, to the best of our knowledge, are not predicted
by existing theories. One possible interpretation of these
features is in terms of ion acoustic waves. A simple analysis shows that the increase in line spacing is characteristic of the behavior of ion acoustic waves in an expanding plasma. To see this, consider a plasma moving with
background velocity V . An ion acoustic wave traveling
in the same direction as V has a velocity u + V , where
u is the wave velocity in the reference frame of the moving plasma. For an expanding plasma, V increases with
distance in the direction of the expansion which means
that the velocity of successive density peaks in the ion
wave will also increase with distance in the expansion
direction, producing peaks at dierent velocities. These
peaks will be super-imposed on the exponential background spectrum as observed in Fig. 5. Using once again
the isothermal, self-similar expansion model, where the
plasma velocity at a given time is proportional to position, it can be shown that the dierence in velocity,
V , between successive peaks is given approximately by
V = 2(u + V )=!t where ! is the wave frequency, and
t is the expansion time. Should !t be constant over this
velocity range, V would be proportional to V . For the
lines in Fig. 5, a plot of V versus V , shown in Fig. 6,
is well approximated by a straight line. Further studies will be necessary to understand the origin of these
waves. Perhaps they are produced by stimulated Brillouin scattering, known to occur only at low levels on
OMEGA [17], or by vibrations in the near-solid plasma
before expansion.
In summary, fast protons with > 1 MeV energies are
produced on targets irradiated by the OMEGA, 60-beam
laser system { energies more than 5 times greater than
previously2 observed on single-beam experiments at the
same I . The total energy in fast protons above 200
keV is 10 3 of the laser energy. Hot electron temperatures inferred from the proton spectra are approximately
10 { 20 keV, giving a ratio of maximum proton energy
to hot electron temperature close to that observed previously. X-ray measurements indicate the presence of a
50 250 keV electron distribution also carrying 10 3
of the laser energy. The dierence between the proton
and x-ray inferred hot electron temperatures may indicate that these techniques are complementary ways of examining the hot electron distribution. Particularly striking is the new observation of intense spectral lines which
may be associated with ion acoustic waves in the expanding plasma. The enhanced ion energies and appearance
of discrete, spectral lines may be of interest for future
ion-acceleration schemes using high-intensity lasers.
We are indebted to the OMEGA operations group
for their expert help. This work was supported in
part by the U.S. Dept. of Energy Contract Number DE-FG03-99SF21782, LLE sub-contract number
PO410025G, LLNL sub-contract number B313975, and
the U.S. Dept. of Energy OÆce of Inertial Connement
Fusion under Cooperative Agreement No. DE-FC0392SF19460.
4
[1] T. H. Tan, G. H. McCall, A. H. Williams, Phys. Fluids
27, 296 (1984)
[2] F. N. Beg et al., Phys. Plasmas 4, 447 (1997)
[3] S. J. Gitomer et al., Phys. Fluids 29, 2679 (1986)
[4] F. Begay, D. W. Forslund, Phys. Fluids 25, 1675 (1982)
[5] R. Decoste, B. H. Ripin, Phys. Rev. Lett. 40, 34 (1978)
[6] A. P. Fews et al., Phys. Rev. Lett. 73, 1801 (1994)
[7] J. E. Crow, P. L. Auer, J. E. Allen, J. Plasma Phys. 14,
65 (1975)
[8] L. M. Wickens, J. E. Allen, P. T. Rumsby, Phys. Rev.
Lett. 41, 243 (1978)
[9] Y. Kishimoto et al., Phys. Fluids 26, 2308 (1983)
[10] W. Priedhorsky et al., Phys. Rev. Lett. 47, 1661 (1981)
[11] C. Chan et al., Phys. Fluids 27 266 (1984)
[12] T. R. Boehly et al., Opt. Comm., 133, 495 (1997)
[13] S. Skupsky, R. S. Craxton, Phys. Plasmas 6, 2157 (1999)
[14] D. G. Hicks et al., Rev. Sci. Instrum. 68, 589 (1997)
[15] D. G. Hicks, Ph.D. Thesis, Massachusetts Institute of
Technology (1999)
[16] C. Stockl, private communication, Nov. 1999
[17] S. P. Regan et al., Phys. Plasmas 6, 2072 (1999)
5


