Document 11278820
advertisement
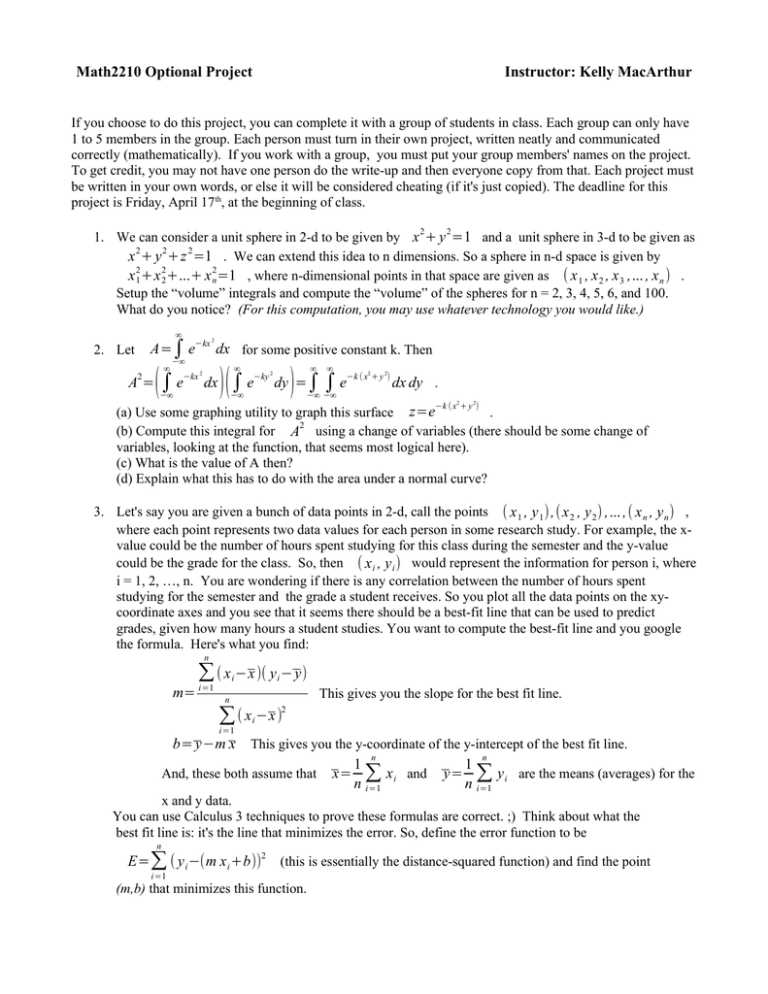
Math2210 Optional Project Instructor: Kelly MacArthur If you choose to do this project, you can complete it with a group of students in class. Each group can only have 1 to 5 members in the group. Each person must turn in their own project, written neatly and communicated correctly (mathematically). If you work with a group, you must put your group members' names on the project. To get credit, you may not have one person do the write-up and then everyone copy from that. Each project must be written in your own words, or else it will be considered cheating (if it's just copied). The deadline for this project is Friday, April 17th, at the beginning of class. 2 2 1. We can consider a unit sphere in 2-d to be given by x + y =1 and a unit sphere in 3-d to be given as x 2 + y 2 +z 2 =1 . We can extend this idea to n dimensions. So a sphere in n-d space is given by x 21 +x 22+...+ x 2n=1 , where n-dimensional points in that space are given as ( x 1 , x 2 , x 3 ,... , x n ) . Setup the “volume” integrals and compute the “volume” of the spheres for n = 2, 3, 4, 5, 6, and 100. What do you notice? (For this computation, you may use whatever technology you would like.) ∞ A=∫ e−kx dx for some positive constant k. Then 2. Let 2 A= ∞ 2 −∞ ∞ ∞ ∞ (−∞∫ e−kx dx )(−∞∫ e−ky dy )=−∞∫ −∞∫ e−k ( x + y ) dx dy 2 2 2 2 . −k ( x2 + y 2) (a) Use some graphing utility to graph this surface z=e . 2 (b) Compute this integral for A using a change of variables (there should be some change of variables, looking at the function, that seems most logical here). (c) What is the value of A then? (d) Explain what this has to do with the area under a normal curve? 3. Let's say you are given a bunch of data points in 2-d, call the points ( x 1 , y 1 ) ,( x 2 , y 2 ) ,... ,( x n , y n ) , where each point represents two data values for each person in some research study. For example, the xvalue could be the number of hours spent studying for this class during the semester and the y-value could be the grade for the class. So, then ( x i , y i ) would represent the information for person i, where i = 1, 2, …, n. You are wondering if there is any correlation between the number of hours spent studying for the semester and the grade a student receives. So you plot all the data points on the xycoordinate axes and you see that it seems there should be a best-fit line that can be used to predict grades, given how many hours a student studies. You want to compute the best-fit line and you google the formula. Here's what you find: n ∑ ( x i −x )( y i − y) m= i=1 n This gives you the slope for the best fit line. ( x i −x ) ∑ i=1 2 b= y−m x This gives you the y-coordinate of the y-intercept of the best fit line. n n 1 1 And, these both assume that x= ∑ x i and y= ∑ y i are the means (averages) for the n i=1 n i=1 x and y data. You can use Calculus 3 techniques to prove these formulas are correct. ;) Think about what the best fit line is: it's the line that minimizes the error. So, define the error function to be n E= ∑ ( y i −(m x i +b))2 (this is essentially the distance-squared function) and find the point i=1 (m,b) that minimizes this function. Math2210 Optional Project unid: ______________________ Instructor: Kelly MacArthur Special Number: __________ To get any credit for this project, follow these directions precisely. 1. Write your special number and unid on the top of this page. 2. Staple (and I really mean staple, not some other creative solution) this as the top sheet to the rest of the papers with your work neatly written out. Make sure all the pages are in order. 3. Turn it in at the beginning of class on Friday, April 17th. 4. This will be graded with partial credit, so even if you don't finish everything, it will be beneficial to turn in what you have.
