Math 3080 § 1. Leather Data: Three Factor Name: Example
advertisement
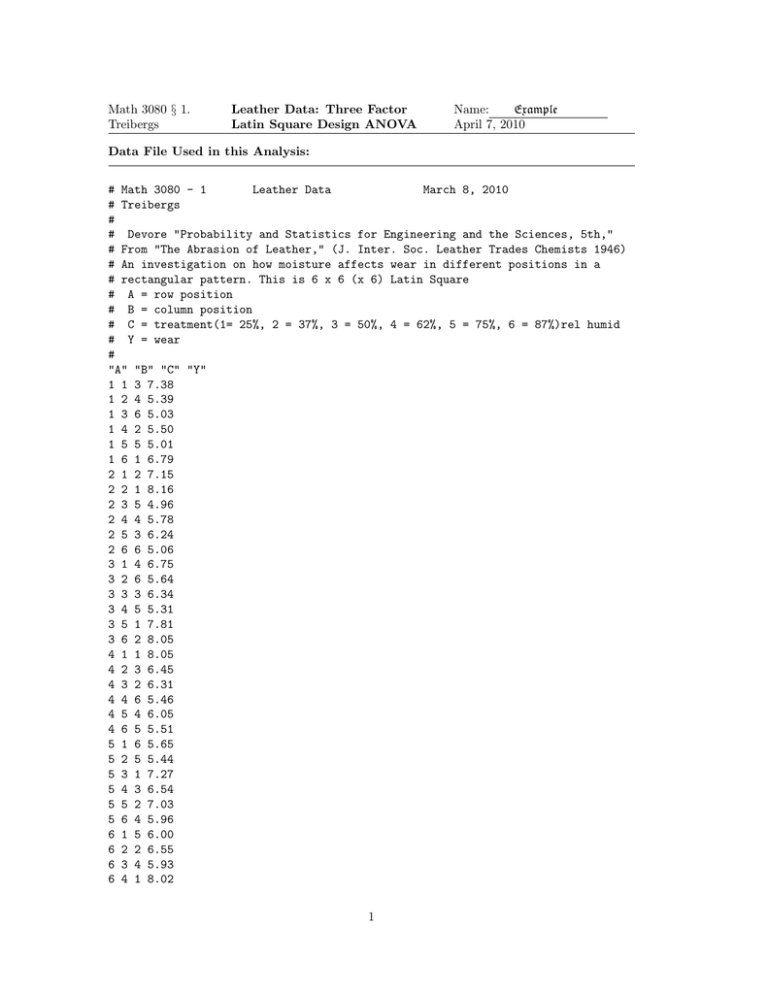
Math 3080 § 1. Treibergs Leather Data: Three Factor Latin Square Design ANOVA Name: Example April 7, 2010 Data File Used in this Analysis: # Math 3080 - 1 Leather Data March 8, 2010 # Treibergs # # Devore "Probability and Statistics for Engineering and the Sciences, 5th," # From "The Abrasion of Leather," (J. Inter. Soc. Leather Trades Chemists 1946) # An investigation on how moisture affects wear in different positions in a # rectangular pattern. This is 6 x 6 (x 6) Latin Square # A = row position # B = column position # C = treatment(1= 25%, 2 = 37%, 3 = 50%, 4 = 62%, 5 = 75%, 6 = 87%)rel humid # Y = wear # "A" "B" "C" "Y" 1 1 3 7.38 1 2 4 5.39 1 3 6 5.03 1 4 2 5.50 1 5 5 5.01 1 6 1 6.79 2 1 2 7.15 2 2 1 8.16 2 3 5 4.96 2 4 4 5.78 2 5 3 6.24 2 6 6 5.06 3 1 4 6.75 3 2 6 5.64 3 3 3 6.34 3 4 5 5.31 3 5 1 7.81 3 6 2 8.05 4 1 1 8.05 4 2 3 6.45 4 3 2 6.31 4 4 6 5.46 4 5 4 6.05 4 6 5 5.51 5 1 6 5.65 5 2 5 5.44 5 3 1 7.27 5 4 3 6.54 5 5 2 7.03 5 6 4 5.96 6 1 5 6.00 6 2 2 6.55 6 3 4 5.93 6 4 1 8.02 1 6 5 6 5.80 6 6 3 6.61 R Session: R version 2.10.1 (2009-12-14) Copyright (C) 2009 The R Foundation for Statistical Computing ISBN 3-900051-07-0 R is free software and comes with ABSOLUTELY NO WARRANTY. You are welcome to redistribute it under certain conditions. Type ’license()’ or ’licence()’ for distribution details. Natural language support but running in an English locale R is a collaborative project with many contributors. Type ’contributors()’ for more information and ’citation()’ on how to cite R or R packages in publications. Type ’demo()’ for some demos, ’help()’ for on-line help, or ’help.start()’ for an HTML browser interface to help. Type ’q()’ to quit R. [R.app GUI 1.31 (5538) powerpc-apple-darwin8.11.1] [Workspace restored from /Users/andrejstreibergs/.RData] > tt > tt A 1 1 2 1 3 1 4 1 5 1 6 1 7 2 8 2 9 2 10 2 11 2 12 2 13 3 14 3 15 3 16 3 17 3 18 3 19 4 20 4 21 4 <- read.table("M3081DataLeather.txt",header=TRUE) B 1 2 3 4 5 6 1 2 3 4 5 6 1 2 3 4 5 6 1 2 3 C 3 4 6 2 5 1 2 1 5 4 3 6 4 6 3 5 1 2 1 3 2 Y 7.38 5.39 5.03 5.50 5.01 6.79 7.15 8.16 4.96 5.78 6.24 5.06 6.75 5.64 6.34 5.31 7.81 8.05 8.05 6.45 6.31 2 22 4 4 6 5.46 23 4 5 4 6.05 24 4 6 5 5.51 25 5 1 6 5.65 26 5 2 5 5.44 27 5 3 1 7.27 28 5 4 3 6.54 29 5 5 2 7.03 30 5 6 4 5.96 31 6 1 5 6.00 32 6 2 2 6.55 33 6 3 4 5.93 34 6 4 1 8.02 35 6 5 6 5.80 36 6 6 3 6.61 > attach(tt) >#==============RANDOM LATIN SQUARE USED HERE FOR TREATMENT C============ > xtabs(C~A+B) B A 1 2 3 4 5 6 1 3 4 6 2 5 1 2 2 1 5 4 3 6 3 4 6 3 5 1 2 4 1 3 2 6 4 5 5 6 5 1 3 2 4 6 5 2 4 1 6 3 > A <- factor(A) > B <- factor(B) > C <- factor(C) >#=============================DATA BY ROW AND COLUMN==================== > xtabs(Y~A+B) B A 1 2 3 4 5 6 1 7.38 5.39 5.03 5.50 5.01 6.79 2 7.15 8.16 4.96 5.78 6.24 5.06 3 6.75 5.64 6.34 5.31 7.81 8.05 4 8.05 6.45 6.31 5.46 6.05 5.51 5 5.65 5.44 7.27 6.54 7.03 5.96 6 6.00 6.55 5.93 8.02 5.80 6.61 3 >#==================================RUN ANOVA============================= > f1 <- aov( Y~A+B+C);anova(f1) Analysis of Variance Table Response: Y Df Sum Sq Mean Sq F value Pr(>F) A 5 2.1897 0.4379 2.5106 0.06407 . B 5 2.5743 0.5149 2.9516 0.03731 * C 5 23.5301 4.7060 26.9789 3.03e-08 *** Residuals 20 3.4887 0.1744 --Signif. codes: 0 *** 0.001 ** 0.01 * 0.05 . 0.1 1 >#===============================SUMMARIZE MEANS========================== > tapply(Y,C,summary) $‘1‘ Min. 1st Qu. Median Mean 3rd Qu. Max. 6.790 7.405 7.915 7.683 8.042 8.160 $‘2‘ Min. 1st Qu. 5.500 6.370 Median 6.790 Mean 3rd Qu. 6.765 7.120 Max. 8.050 $‘3‘ Min. 1st Qu. 6.240 6.368 Median 6.495 Mean 3rd Qu. 6.593 6.592 Max. 7.380 $‘4‘ Min. 1st Qu. 5.390 5.818 Median 5.945 Mean 3rd Qu. 5.977 6.028 Max. 6.750 $‘5‘ Min. 1st Qu. 4.960 5.085 Median 5.375 Mean 3rd Qu. 5.372 5.493 Max. 6.000 $‘6‘ Min. 1st Qu. 5.030 5.160 Median 5.550 Mean 3rd Qu. 5.440 5.648 Max. 5.800 4 > model.tables(f1, "means", se=TRUE) Tables of means Grand mean 6.305 A A 1 2 3 4 5 6 5.850 6.225 6.650 6.305 6.315 6.485 B B 1 2 3 4 5 6 6.830 6.272 5.973 6.102 6.323 6.330 C C 1 2 3 4 5 6 7.683 6.765 6.593 5.977 5.372 5.440 Standard errors for differences of means A B C 0.2411 0.2411 0.2411 replic. 6 6 6 > model.tables(f1, "effects", se=TRUE) Tables of effects A 1 2 -0.455 -0.080 3 0.345 4 0.000 5 0.010 6 0.180 B 1 2 3 4 0.5250 -0.0333 -0.3317 -0.2033 5 0.0183 6 0.0250 C 1 1.3783 2 0.4600 3 4 5 6 0.2883 -0.3283 -0.9333 -0.8650 Standard errors of effects A B C 0.1705 0.1705 0.1705 replic. 6 6 6 > 5 >#=============================TUKEY HSD=============================== > sort(tapply(Y,C,mean)) 5 6 4 3 2 1 5.371667 5.440000 5.976667 6.593333 6.765000 7.683333 > TukeyHSD(f1,which="C",ordered=TRUE) Tukey multiple comparisons of means 95% family-wise confidence level factor levels have been ordered Fit: aov(formula = Y ~ A + B + C) $C 6-5 4-5 3-5 2-5 1-5 4-6 3-6 2-6 1-6 3-4 2-4 1-4 2-3 1-3 1-2 diff 0.06833333 0.60500000 1.22166667 1.39333333 2.31166667 0.53666667 1.15333333 1.32500000 2.24333333 0.61666667 0.78833333 1.70666667 0.17166667 1.09000000 0.91833333 lwr -0.68960522 -0.15293855 0.46372811 0.63539478 1.55372811 -0.22127189 0.39539478 0.56706145 1.48539478 -0.14127189 0.03039478 0.94872811 -0.58627189 0.33206145 0.16039478 upr 0.8262719 1.3629386 1.9796052 2.1512719 3.0696052 1.2946052 1.9112719 2.0829386 3.0012719 1.3746052 1.5462719 2.4646052 0.9296052 1.8479386 1.6762719 p adj 0.9997113 0.1683501 0.0007299 0.0001513 0.0000001 0.2697646 0.0013767 0.0002818 0.0000001 0.1545364 0.0385446 0.0000097 0.9782473 0.0024825 0.0121211 >#==========================TUKEY HSD BY HAND============================ > sort(tapply(Y,C,mean)) 5 6 4 3 2 1 5.371667 5.440000 5.976667 6.593333 6.765000 7.683333 > Q <- qtukey(.95,6,20) > Q [1] 4.445237 > HSD <- Q*sqrt(0.1744/6);HSD [1] 0.7578661 >#=============HSD INTERVALS ABOUT THE MEANS============================== > sort(tapply(Y,C,mean))-HSD;sort(tapply(Y,C,mean));sort(tapply(Y,C,mean))+HSD 5 6 4 3 2 1 4.613801 4.682134 5.218801 5.835467 6.007134 6.925467 5 6 4 3 2 1 5.371667 5.440000 5.976667 6.593333 6.765000 7.683333 5 6 4 3 2 1 6.129533 6.197866 6.734533 7.351199 7.522866 8.441199 6 >#=============================PLOT TUKEY HSD=========================== > par(las=1) > plot(TukeyHSD(f1,which="C",ordered=TRUE)) > abline(v=0,lty=5) 7 >#=====================================PLOT DESIGN AND INTERACTION======== > par(las=0) > layout(matrix(1:2,ncol=2)) > plot.design(data.frame(A,B,C,Y)) > interaction.plot(C,A,Y) >#=============================PLOT DIAGNOSTICS============================= > layout(matrix(1:4,ncol=2)) > plot(Y~C) > plot(rstandard(f1)~fitted(f1),xlab="Predicted Values",ylab="Standard. Resid.", ylim=max(abs(rstandard(f1)))*c(-1,1));abline(h=c(0,-2,2),lty=c(2,3,3)) > plot(fitted(f1)~Y,ylab="Y hat");abline(0,1) > qqnorm(rstandard(f1),ylab="Standard. Resid.", ylim=max(abs(rstandard(f1)))*c(-1,1));abline(h=c(0,-2,2),lty=c(2,3,3));abline(0,1) >#==============================SHAPIRO-WILK TEST FOR NORMALITY OF RESID.===== > shapiro.test(rstandard(f1)) Shapiro-Wilk normality test data: rstandard(f1) W = 0.9462, p-value = 0.07926 > 8 9 10
