Math 3080 § 1. Rail Data: One-Way Name: Example
advertisement
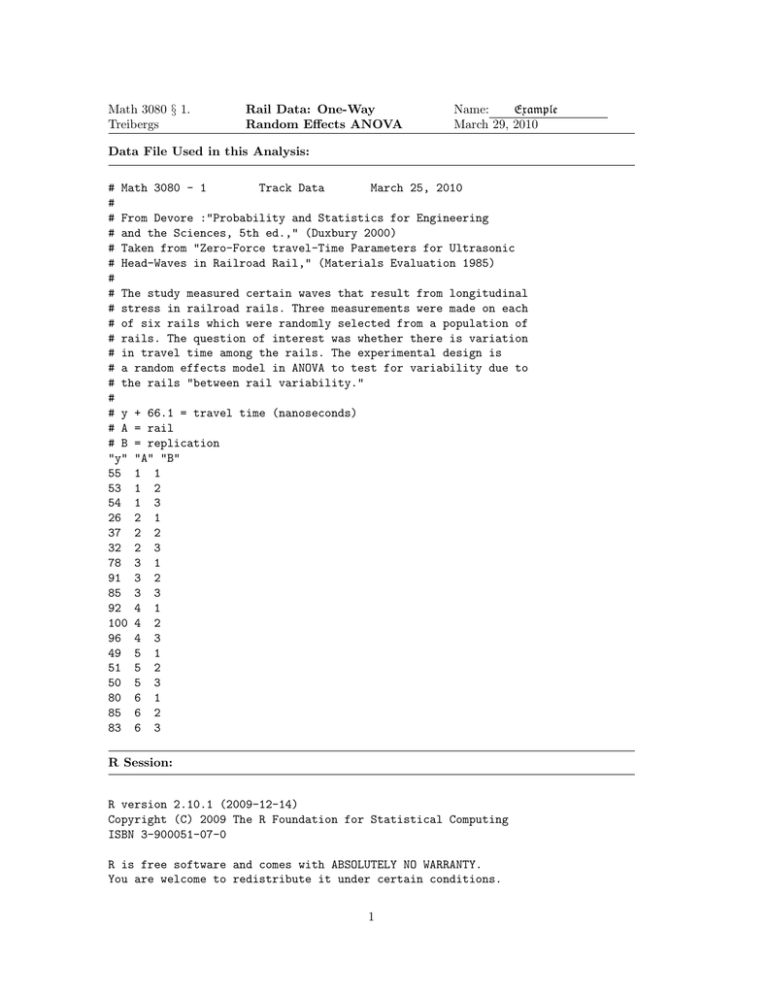
Math 3080 § 1. Treibergs Rail Data: One-Way Random Effects ANOVA Name: Example March 29, 2010 Data File Used in this Analysis: # Math 3080 - 1 Track Data March 25, 2010 # # From Devore :"Probability and Statistics for Engineering # and the Sciences, 5th ed.," (Duxbury 2000) # Taken from "Zero-Force travel-Time Parameters for Ultrasonic # Head-Waves in Railroad Rail," (Materials Evaluation 1985) # # The study measured certain waves that result from longitudinal # stress in railroad rails. Three measurements were made on each # of six rails which were randomly selected from a population of # rails. The question of interest was whether there is variation # in travel time among the rails. The experimental design is # a random effects model in ANOVA to test for variability due to # the rails "between rail variability." # # y + 66.1 = travel time (nanoseconds) # A = rail # B = replication "y" "A" "B" 55 1 1 53 1 2 54 1 3 26 2 1 37 2 2 32 2 3 78 3 1 91 3 2 85 3 3 92 4 1 100 4 2 96 4 3 49 5 1 51 5 2 50 5 3 80 6 1 85 6 2 83 6 3 R Session: R version 2.10.1 (2009-12-14) Copyright (C) 2009 The R Foundation for Statistical Computing ISBN 3-900051-07-0 R is free software and comes with ABSOLUTELY NO WARRANTY. You are welcome to redistribute it under certain conditions. 1 Type ’license()’ or ’licence()’ for distribution details. Natural language support but running in an English locale R is a collaborative project with many contributors. Type ’contributors()’ for more information and ’citation()’ on how to cite R or R packages in publications. Type ’demo()’ for some demos, ’help()’ for on-line help, or ’help.start()’ for an HTML browser interface to help. Type ’q()’ to quit R. [R.app GUI 1.31 (5538) powerpc-apple-darwin8.11.1] [Workspace restored from /Users/andrejstreibergs/.RData] > tt <- read.table("M3081DataRail.txt",header=TRUE) > tt y A B 1 55 1 1 2 53 1 2 3 54 1 3 4 26 2 1 5 37 2 2 6 32 2 3 7 78 3 1 8 91 3 2 9 85 3 3 10 92 4 1 11 100 4 2 12 96 4 3 13 49 5 1 14 51 5 2 15 50 5 3 16 80 6 1 17 85 6 2 18 83 6 3 > attach(tt) > A <- factor(A) > B <- factor(B) >#============================DISPLAY DATA AS MATRIX================ > xtabs(y~A+B) B A 1 2 3 1 55 53 54 2 26 37 32 3 78 91 85 4 92 100 96 5 49 51 50 6 80 85 83 2 >#============================SUMMARY STATISTICS==================== > tapply(y,A,summary) $‘1‘ Min. 1st Qu. Median Mean 3rd Qu. Max. 53.0 53.5 54.0 54.0 54.5 55.0 $‘2‘ Min. 1st Qu. 26.00 29.00 Median 32.00 Mean 3rd Qu. 31.67 34.50 Max. 37.00 $‘3‘ Min. 1st Qu. 78.00 81.50 Median 85.00 Mean 3rd Qu. 84.67 88.00 Max. 91.00 $‘4‘ Min. 1st Qu. 92 94 Median 96 Mean 3rd Qu. 96 98 Max. 100 $‘5‘ Min. 1st Qu. 49.0 49.5 Median 50.0 Mean 3rd Qu. 50.0 50.5 Max. 51.0 $‘6‘ Min. 1st Qu. 80.00 81.50 Median 83.00 Mean 3rd Qu. 82.67 84.00 Max. 85.00 > tapply(y,A,mean) 1 2 3 4 5 6 54.00000 31.66667 84.66667 96.00000 50.00000 82.66667 > tapply(y,A,sd) 1 2 3 4 5 6 1.000000 5.507571 6.506407 4.000000 1.000000 2.516611 >#=================================PLOT BOXPLOTS AND DESIGN================= > layout(matrix(1:2,ncol=2)) > plot(y~A) > plot.design(data.frame(y,A,B)) >#==================================RUN ONE-WAY ANOVA========================= > f2 <- aov(y~A);summary(f2) Df Sum Sq Mean Sq F value Pr(>F) A 5 9310.5 1862.10 115.18 1.033e-09 *** Residuals 12 194.0 16.17 --Signif. codes: 0 *** 0.001 ** 0.01 * 0.05 . 0.1 1 >#=======================SORT MEANS, TUKEY HSD, PLOT TUKEY HSD================ 3 > sort(tapply(y,A,mean)) 2 5 1 6 3 4 31.66667 50.00000 54.00000 82.66667 84.66667 96.00000 > TukeyHSD(f2,ordered=TRUE) Tukey multiple comparisons of means 95% family-wise confidence level factor levels have been ordered Fit: aov(formula = y ~ A) $A 5-2 1-2 6-2 3-2 4-2 1-5 6-5 3-5 4-5 6-1 3-1 4-1 3-6 4-6 4-3 diff 18.33333 22.33333 51.00000 53.00000 64.33333 4.00000 32.66667 34.66667 46.00000 28.66667 30.66667 42.00000 2.00000 13.33333 11.33333 lwr 7.3061553 11.3061553 39.9728220 41.9728220 53.3061553 -7.0271780 21.6394887 23.6394887 34.9728220 17.6394887 19.6394887 30.9728220 -9.0271780 2.3061553 0.3061553 upr 29.36051 33.36051 62.02718 64.02718 75.36051 15.02718 43.69384 45.69384 57.02718 39.69384 41.69384 53.02718 13.02718 24.36051 22.36051 p adj 0.0012837 0.0002129 0.0000000 0.0000000 0.0000000 0.8202141 0.0000044 0.0000023 0.0000001 0.0000176 0.0000087 0.0000003 0.9882413 0.0152884 0.0427569 > par(las=1) > plot(TukeyHSD(f2,ordered=TRUE));abline(v=0,lty=6) >#================================DIAGNOSTIC PLOTS========================== > par(las=0) > > layout(matrix(1:4,ncol=2)) > plot(y~A) > plot(rstudent(f2)~fitted(f2),xlab="Predicted Values",ylab="Student. Resid", ylim=max(abs(rstudent(f2)))*c(-1,1));abline(h=c(0,-2,2),lty=c(2,3,3)) > plot(fitted(f2)~y,ylab="y hat");abline(0,1,lty=1) > qqnorm(rstudent(f2),ylim=max(abs(rstudent(f2)))*c(-1,1),ylab="Student. Resid.") > abline(0,1,lty=1);abline(h=c(0,-2,2),lty=c(2,3,3)) >#===========================JUST FOR FUN===================================== > interaction.plot(A,B,y) > interaction.plot(B,A,y) > 4 5 6 7
