Math 3080 § 1. Spectroscopy Data: Name: Example
advertisement
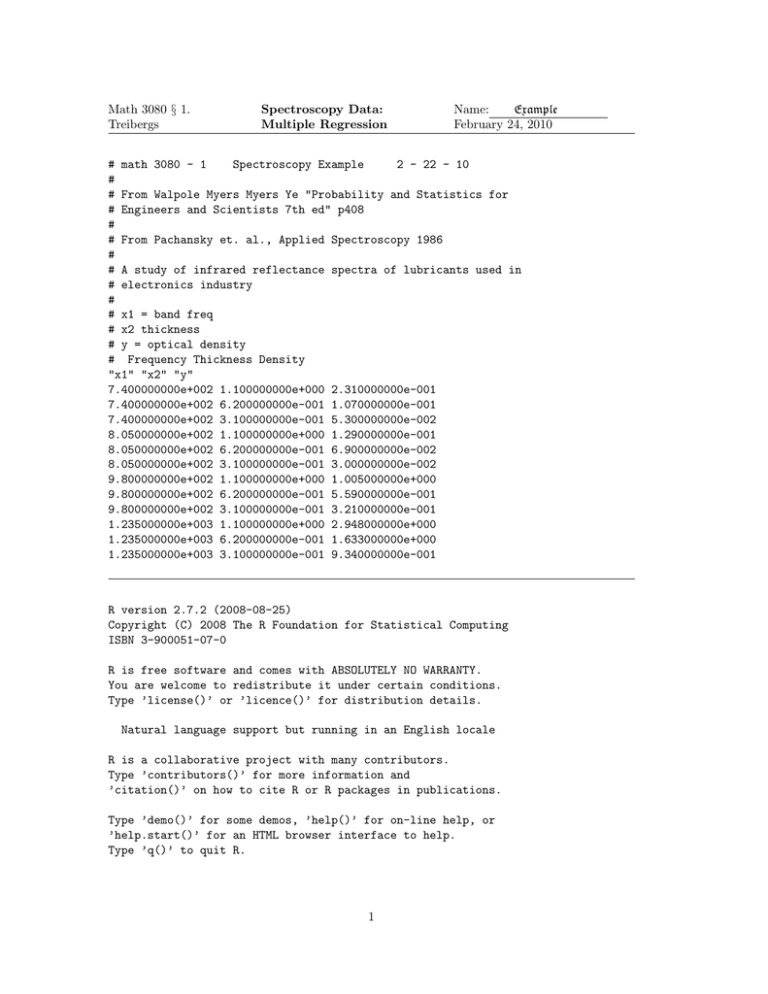
Math 3080 § 1. Treibergs Spectroscopy Data: Multiple Regression Name: Example February 24, 2010 # math 3080 - 1 Spectroscopy Example 2 - 22 - 10 # # From Walpole Myers Myers Ye "Probability and Statistics for # Engineers and Scientists 7th ed" p408 # # From Pachansky et. al., Applied Spectroscopy 1986 # # A study of infrared reflectance spectra of lubricants used in # electronics industry # # x1 = band freq # x2 thickness # y = optical density # Frequency Thickness Density "x1" "x2" "y" 7.400000000e+002 1.100000000e+000 2.310000000e-001 7.400000000e+002 6.200000000e-001 1.070000000e-001 7.400000000e+002 3.100000000e-001 5.300000000e-002 8.050000000e+002 1.100000000e+000 1.290000000e-001 8.050000000e+002 6.200000000e-001 6.900000000e-002 8.050000000e+002 3.100000000e-001 3.000000000e-002 9.800000000e+002 1.100000000e+000 1.005000000e+000 9.800000000e+002 6.200000000e-001 5.590000000e-001 9.800000000e+002 3.100000000e-001 3.210000000e-001 1.235000000e+003 1.100000000e+000 2.948000000e+000 1.235000000e+003 6.200000000e-001 1.633000000e+000 1.235000000e+003 3.100000000e-001 9.340000000e-001 R version 2.7.2 (2008-08-25) Copyright (C) 2008 The R Foundation for Statistical Computing ISBN 3-900051-07-0 R is free software and comes with ABSOLUTELY NO WARRANTY. You are welcome to redistribute it under certain conditions. Type ’license()’ or ’licence()’ for distribution details. Natural language support but running in an English locale R is a collaborative project with many contributors. Type ’contributors()’ for more information and ’citation()’ on how to cite R or R packages in publications. Type ’demo()’ for some demos, ’help()’ for on-line help, or ’help.start()’ for an HTML browser interface to help. Type ’q()’ to quit R. 1 > ss <> ss x1 1 740 2 740 3 740 4 805 5 805 6 805 7 980 8 980 9 980 10 1235 11 1235 12 1235 read.table("M3080DataSpectroscopy.txt", header=TRUE) x2 1.10 0.62 0.31 1.10 0.62 0.31 1.10 0.62 0.31 1.10 0.62 0.31 y 0.231 0.107 0.053 0.129 0.069 0.030 1.005 0.559 0.321 2.948 1.633 0.934 > attach(ss) > f <- lm(y ~ x1 + x2) > summary(f); anova(f) Call: lm(formula = y ~ x1 + x2) Residuals: Min 1Q Median -0.45373 -0.20243 -0.08618 3Q 0.20204 Max 0.81167 Coefficients: Estimate Std. Error t value Pr(>|t|) (Intercept) -3.3726733 0.6359963 -5.303 0.000492 x1 0.0036167 0.0006121 5.908 0.000227 x2 0.9475989 0.3608943 2.626 0.027552 --Signif. codes: 0 *** 0.001 ** 0.01 * 0.05 . 0.1 *** *** * 1 Residual standard error: 0.4063 on 9 degrees of freedom Multiple R-squared: 0.8228,Adjusted R-squared: 0.7835 F-statistic: 20.9 on 2 and 9 DF, p-value: 0.0004146 Analysis of Variance Table Response: y Df Sum Sq Mean Sq F value Pr(>F) x1 1 5.7627 5.7627 34.9082 0.0002267 *** x2 1 1.1381 1.1381 6.8943 0.0275524 * Residuals 9 1.4857 0.1651 --Signif. codes: 0 *** 0.001 ** 0.01 * 0.05 . 0.1 2 1 > > > > > > > > > > > > > > > > > > layout(matrix(1:4, nrow = 2)) plot(y ~ x1) plot(y ~ x2) eps <- residuals(f) yhat <- fitted(f) plot(yhat, eps, xlab="Fitted values",ylab="Residuals",ylim=max(abs(eps))*c(-1,1)) abline(h=0, lty=2) qqnorm(eps, xlab="Theoretical Quantiles",ylab="Residuals") qqline(eps) seps <- rstudent(f) layout(matrix(1:4, nrow = 2)) plot(seps ~ x1, ylab = "Studentized Residuals") plot(seps ~ x2, ylab = "Studentized Residuals") plot(yhat~y,ylab="Fitted Values",xlab="Observed y") qqnorm(seps,ylab="Studentized Residuals") qqline(seps) 3 4 5
