Stat 301 Lab 3 Due September 22, 2014
advertisement
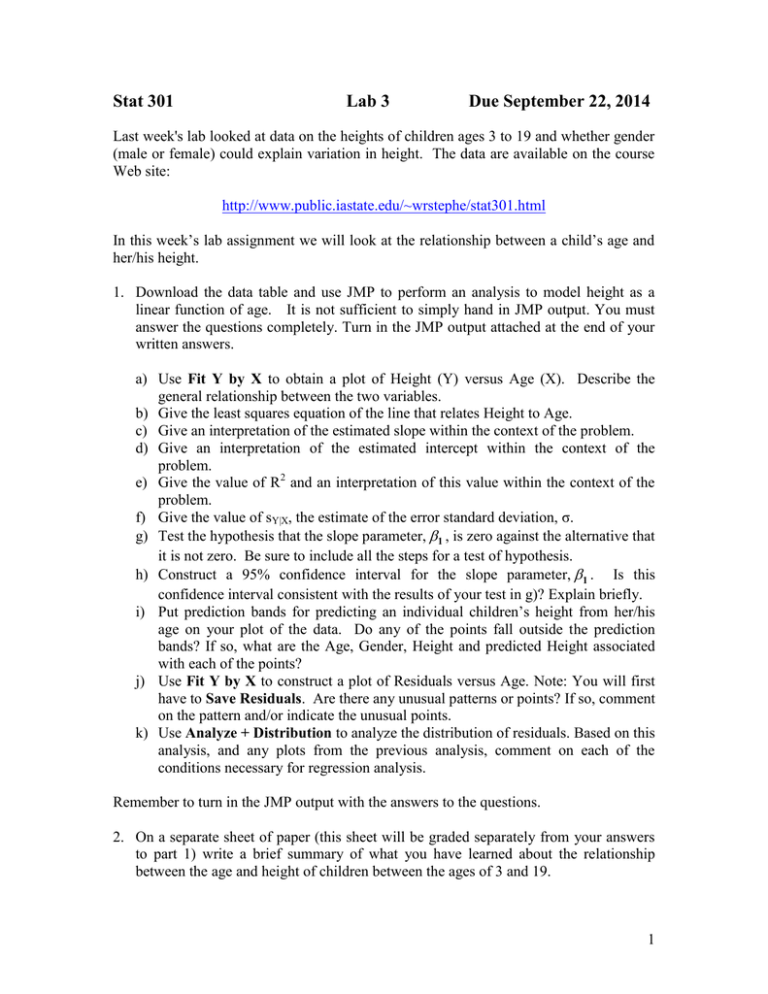
Stat 301 Lab 3 Due September 22, 2014 Last week's lab looked at data on the heights of children ages 3 to 19 and whether gender (male or female) could explain variation in height. The data are available on the course Web site: http://www.public.iastate.edu/~wrstephe/stat301.html In this week’s lab assignment we will look at the relationship between a child’s age and her/his height. 1. Download the data table and use JMP to perform an analysis to model height as a linear function of age. It is not sufficient to simply hand in JMP output. You must answer the questions completely. Turn in the JMP output attached at the end of your written answers. a) Use Fit Y by X to obtain a plot of Height (Y) versus Age (X). Describe the general relationship between the two variables. b) Give the least squares equation of the line that relates Height to Age. c) Give an interpretation of the estimated slope within the context of the problem. d) Give an interpretation of the estimated intercept within the context of the problem. e) Give the value of R2 and an interpretation of this value within the context of the problem. f) Give the value of sY|X, the estimate of the error standard deviation, σ. g) Test the hypothesis that the slope parameter, 1 , is zero against the alternative that it is not zero. Be sure to include all the steps for a test of hypothesis. h) Construct a 95% confidence interval for the slope parameter, 1 . Is this confidence interval consistent with the results of your test in g)? Explain briefly. i) Put prediction bands for predicting an individual children’s height from her/his age on your plot of the data. Do any of the points fall outside the prediction bands? If so, what are the Age, Gender, Height and predicted Height associated with each of the points? j) Use Fit Y by X to construct a plot of Residuals versus Age. Note: You will first have to Save Residuals. Are there any unusual patterns or points? If so, comment on the pattern and/or indicate the unusual points. k) Use Analyze + Distribution to analyze the distribution of residuals. Based on this analysis, and any plots from the previous analysis, comment on each of the conditions necessary for regression analysis. Remember to turn in the JMP output with the answers to the questions. 2. On a separate sheet of paper (this sheet will be graded separately from your answers to part 1) write a brief summary of what you have learned about the relationship between the age and height of children between the ages of 3 and 19. 1
