Parameter population Population summary of the entire
advertisement
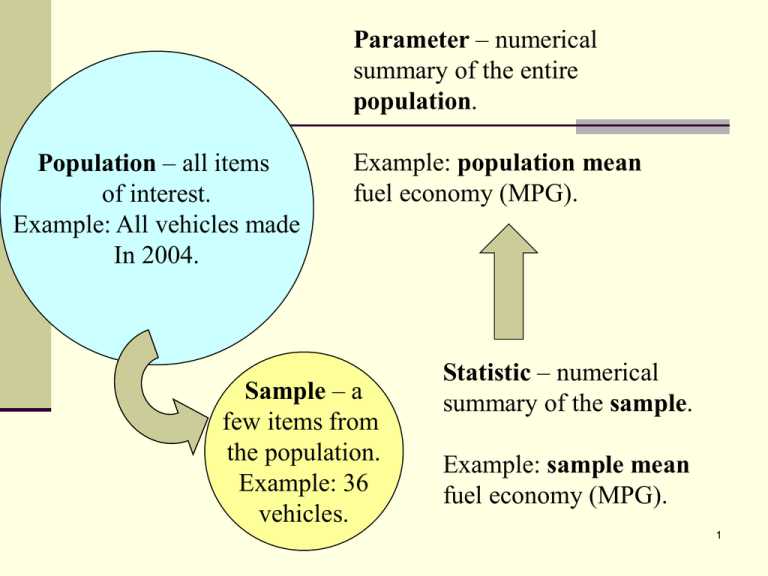
Parameter – numerical summary of the entire population. Population – all items of interest. Example: All vehicles made In 2004. Example: population mean fuel economy (MPG). Sample – a few items from the population. Example: 36 vehicles. Statistic – numerical summary of the sample. Example: sample mean fuel economy (MPG). 1 One-sample model Y •Y represents a value of the variable of interest • represents the population mean • represents the random error associated with an observation 2 Conditions The random error term, , is Independent Identically distributed Normally distributed with standard deviation, 3 Errors Model Error Y Y 4 Residuals Estimate of error (Observation – Fit) Residual ˆ Y Y 5 Residuals Examine the residuals to see if the conditions for statistical inference are met. 6 Checking Conditions Independence. Hard to check this but the fact that we obtained the data through random sampling assures us that the statistical methods should work. 7 Checking Conditions Identically distributed. Check using an outlier box plot. Unusual points may come from a different distribution Check using a histogram. Bimodal shape could indicate two different distributions. 8 Checking Conditions Normally distributed. Check with a histogram. Symmetric and mounded in the middle. Check with a normal quantile plot. Points falling close to a diagonal line. 9 Distributions 3 .99 2 .95 .90 1 .75 .50 Normal Quantile Plot Residual 0 .25 -1 .10 .05 -2 .01 -3 10 6 Count 8 4 2 -7.5 -5 -2.5 0 2.5 5 7.5 10 MPG Residuals Histogram is symmetric and mounded in the middle. Box plot is symmetric with no outliers. Normal quantile plot has points following the diagonal line. 11 MPG Residuals The conditions for statistical inference appear to be satisfied. 12 Two Independent Samples Question In 2000, did men and women differ in terms of their body mass index? 13 Populations random selection 2. Male Inference 1. Female Samples random selection 14 Two-sample model Y i •Y represents a value of the variable of interest • i represents the ith population mean • represents the random error associated with an observation 15 Conditions The random error term, , is Independent Identically distributed Normally distributed with standard deviation, 16 Testing Hypotheses Question In 2000, did men and women differ in terms of their body mass index, on average? 17 Step 1 - Hypotheses H 0 : 1 2 or 1 2 0 H A : 1 2 or 1 2 0 18 Step 2 – Test Statistic Y Y 27.484 26.868 t 1 sp 2 1 1 n1 n2 1 1 7.544 50 50 0.616 t 0.408 1.509 P - value 0.684 19 Step 3 – Decision Fail to reject the null hypothesis because the Pvalue is larger than 0.05. 20 Step 4 – Conclusion On average, men and women in 2000 could have had the same BMI. The difference between males’ and females’ average BMI’s is not statistically significant. 21
