older worker gender differences in using flexible work options bridge jobs/phased retirement
advertisement

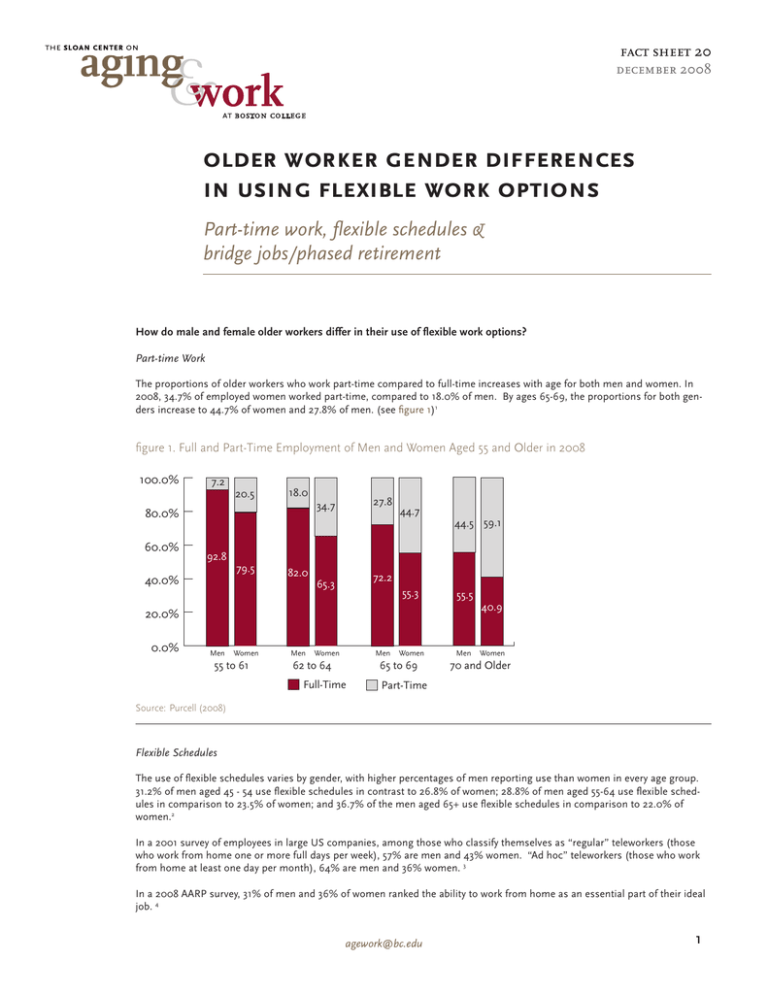
fact sheet 20 december 2008 older worker gender differences in using flexible work options Part-time work, flexible schedules & bridge jobs/phased retirement How do male and female older workers differ in their use of flexible work options? Part-time Work The proportions of older workers who work part-time compared to full-time increases with age for both men and women. In 2008, 34.7% of employed women worked part-time, compared to 18.0% of men. By ages 65-69, the proportions for both genders increase to 44.7% of women and 27.8% of men. (see figure 1)1 figure 1. Full and Part-Time Employment of Men and Women Aged 55 and Older in 2008 100.0% 7.2 20.5 18.0 60.0% 92.8 40.0% 79.5 27.8 34.7 80.0% 82.0 44.7 44.5 59.1 72.2 65.3 55.3 55.5 20.0% 0.0% Men Women 55 to 61 Men Men Women 62 to 64 Women 65 to 69 Full-Time Men 40.9 Women 70 and Older Part-Time Source:Purcell (2008) Flexible Schedules The use of flexible schedules varies by gender, with higher percentages of men reporting use than women in every age group. 31.2% of men aged 45 - 54 use flexible schedules in contrast to 26.8% of women; 28.8% of men aged 55-64 use flexible schedules in comparison to 23.5% of women; and 36.7% of the men aged 65+ use flexible schedules in comparison to 22.0% of women.2 In a 2001 survey of employees in large US companies, among those who classify themselves as “regular” teleworkers (those who work from home one or more full days per week), 57% are men and 43% women. “Ad hoc” teleworkers (those who work from home at least one day per month), 64% are men and 36% women. 3 In a 2008 AARP survey, 31% of men and 36% of women ranked the ability to work from home as an essential part of their ideal job. 4 agework@bc.edu 1 Self-employment, Consulting, Contract Work “Among workers 50 or more years old, wage and salaried employees are much more likely to be women (54%) than are selfemployed independents (27%) and small business owners (37%).” Men in the same age group are more likely to report being self-employed independents (7 %), compared to being wage and salaried employees (46%) and small business owners (63%).6 The prevalence of self-employed full-time career (FTC) workers has increased for both men and women. In 1992, 21% of male FTC workers were self-employed, and this number increased steadily to 35% in 2004. In 1992, 10% of female FTC workers were self employed, and this number also rose steadily to 18% in 2004. (see figure 2)5 figure 2. Percentage Self-Employed Among Men and Women Who Held FTC Jobs in 1992 35 35.0% 30.0% 25.0% 23 21 27 26 24 20.0% 15.0% Men Women 31 17 11 11 12 12 18 14 10.0% 5.0% 0.0% 1992 1994 1996 1998 2000 2002 2004 (51-61) (53-63) (55-65) (57-67) (59-69) (61-71) (63-73) Survey Year (Age of Core Respondents) Source: Authors’ calculations based on the Health and Retirement Study Bridge Jobs and Phased Retirement Among “war babies”(respondents born between 1942-1947) who had full-time career (FTC) jobs since age 50 and who had moved off their FTC job by 2004, 67 % of the men and 71 % of the women first moved to a bridge job.”7 “Phasing after age 65—typically considered normal retirement age—is not uncommon, with 17% of phasers being age 65 or older. Women—who are more likely to phase than men—make up 60% of all phasers, even though they represent less than half of older workers,” according to Watson Wyatt.8 References 1 Purcell, P. (2008). Older workers: Employment and retirement trends - September 15, 2008. Washington, DC: Congressional Research Service. Retrieved from http://opencrs.cdt.org/document/RL30629 2 U.S. Census Bureau. (2005). U.S. Census Bureau, statistical abstract of the United States: 2004-2005. Labor force, employment, and earnings. (Section 12, Table 588, p. 381). Washington, DC: U.S. Census Bureau. Retrieved July 15, 2005, from http://www.census.gov/prod/www/statisticalabstract-2001_2005.html 3 Richman, A. L., Noble, K., & Johnson, A. (2001). When the workplace is many places: The extent and nature of offsite work today. Watertown, MA: WFD Consulting. 4 Groeneman, S. (2008). Staying ahead of the curve 2007: The AARP work and career study. Washington, D.C.: AARP. Retrieved from http://assets. aarp.org/rgcenter/econ/work_career_08.pdf 5 Giandrea, M. D., Cahill, K. E., & Quinn, J. F. (2008). Self employment as a step in the retirement process (Issue Brief No. 15). Chestnut Hill, MA: The Sloan Center on Aging and Work at Boston College. Retrieved from http://agingandwork.bc.edu/documents/IB15_SelfEmployment_Retire.pdf 6 Bond, T. J., Galinsky, M. E., Pitt-Catsouphes, M., & Smyer, M. (2005). Context matters: Insights about older workers from the national study of the changing workforce. Chestnut Hill, MA: Center on Aging & Work/Workplace Flexibility. Retrieved July 31, 2006 from http://agingandwork.bc.edu/ documents/RH01_InsightOlderWorker.pdf 7 Giandrea, M. D., Cahill, K. E., & Quinn, J. F. (2007). An update on bridge jobs: The HRS war babies (Working Paper No. 407). Washington, DC: Bureau of Labor Statistics. Retrieved from http://www.bls.gov/ore/abstract/ec/ec070060.htm 8 Mulvey, J. (2004). Phased retirement: Aligning employer programs with worker preferences - 2004 survey report. Washington, DC: Watson Wyatt Worldwide Project Team: Betty Cohen, with Daniel Mak, and Sarah Weintraub 2 http://www.bc.edu/agingandwork


