family caregiving and the older worker fact sheet 02 december 2009
advertisement
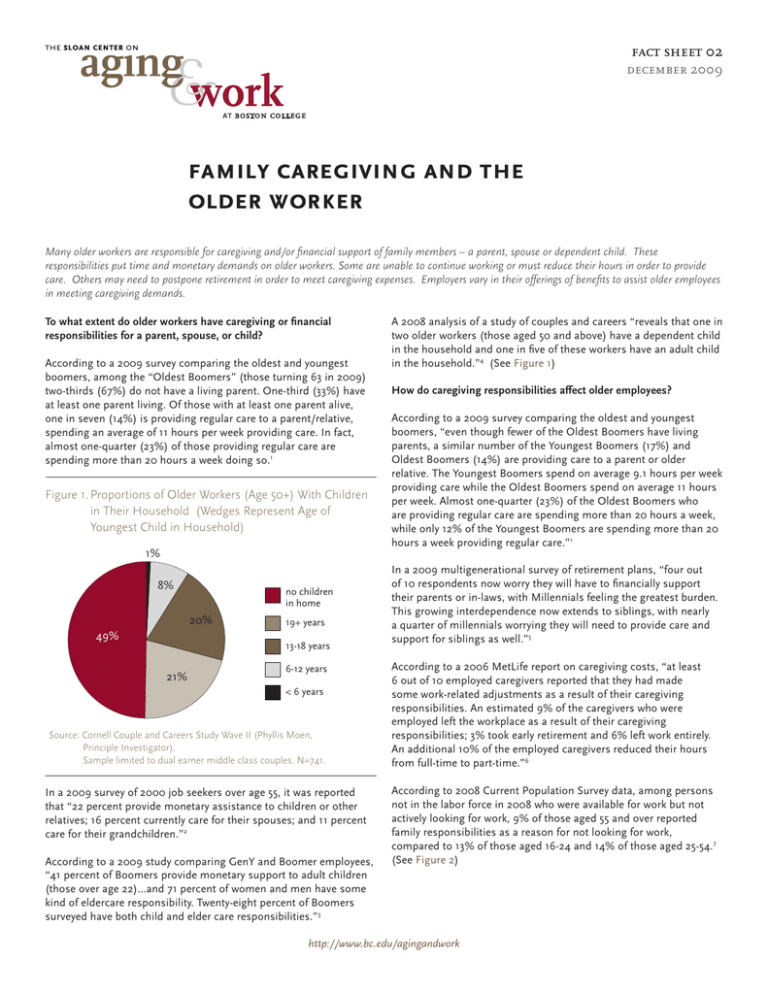
fact sheet 02 december 2009 family caregiving and the older worker Many older workers are responsible for caregiving and/or financial support of family members -- a parent, spouse or dependent child. These responsibilities put time and monetary demands on older workers. Some are unable to continue working or must reduce their hours in order to provide care. Others may need to postpone retirement in order to meet caregiving expenses. Employers vary in their offerings of benefits to assist older employees in meeting caregiving demands. To what extent do older workers have caregiving or financial responsibilities for a parent, spouse, or child? According to a 2009 survey comparing the oldest and youngest boomers, among the “Oldest Boomers” (those turning 63 in 2009) two-thirds (67%) do not have a living parent. One-third (33%) have at least one parent living. Of those with at least one parent alive, one in seven (14%) is providing regular care to a parent/relative, spending an average of 11 hours per week providing care. In fact, almost one-quarter (23%) of those providing regular care are spending more than 20 hours a week doing so.1 Figure 1.Proportions of Older Workers (Age 50+) With Children in Their Household (Wedges Represent Age of Youngest Child in Household) 1% 8% no children in home 20% 49% 19+ years 13-18 years 21% 6-12 years < 6 years Source: Cornell Couple and Careers Study Wave II (Phyllis Moen, Principle Investigator). Sample limited to dual earner middle class couples. N=741. In a 2009 survey of 2000 job seekers over age 55, it was reported that “22 percent provide monetary assistance to children or other relatives; 16 percent currently care for their spouses; and 11 percent care for their grandchildren.”2 According to a 2009 study comparing GenY and Boomer employees, “41 percent of Boomers provide monetary support to adult children (those over age 22)...and 71 percent of women and men have some kind of eldercare responsibility. Twenty-eight percent of Boomers surveyed have both child and elder care responsibilities.”3 1 A 2008 analysis of a study of couples and careers “reveals that one in two older workers (those aged 50 and above) have a dependent child in the household and one in five of these workers have an adult child in the household.”4 (See Figure 1) How do caregiving responsibilities affect older employees? According to a 2009 survey comparing the oldest and youngest boomers, “even though fewer of the Oldest Boomers have living parents, a similar number of the Youngest Boomers (17%) and Oldest Boomers (14%) are providing care to a parent or older relative. The Youngest Boomers spend on average 9.1 hours per week providing care while the Oldest Boomers spend on average 11 hours per week. Almost one-quarter (23%) of the Oldest Boomers who are providing regular care are spending more than 20 hours a week, while only 12% of the Youngest Boomers are spending more than 20 hours a week providing regular care.”1 In a 2009 multigenerational survey of retirement plans, “four out of 10 respondents now worry they will have to financially support their parents or in-laws, with Millennials feeling the greatest burden. This growing interdependence now extends to siblings, with nearly a quarter of millennials worrying they will need to provide care and support for siblings as well.”5 According to a 2006 MetLife report on caregiving costs, “at least 6 out of 10 employed caregivers reported that they had made some work-related adjustments as a result of their caregiving responsibilities. An estimated 9% of the caregivers who were employed left the workplace as a result of their caregiving responsibilities; 3% took early retirement and 6% left work entirely. An additional 10% of the employed caregivers reduced their hours from full-time to part-time.”6 According to 2008 Current Population Survey data, among persons not in the labor force in 2008 who were available for work but not actively looking for work, 9% of those aged 55 and over reported family responsibilities as a reason for not looking for work, compared to 13% of those aged 16-24 and 14% of those aged 25-54.7 (See Figure 2) http://www.bc.edu/agingandwork Figure 2.Persons not in the labor force who are available to work but not actively looking, by age and reasons, 2008 What are employers doing to help their older workers with their caregiving responsibilities? Discouragement over job prospects* 55+ Family Responsibilities 25-54 16-24 In school or training In the same study, 11% of employers with 100 or more employees offered fewer than 12 weeks as the maximum job-guaranteed leave for employees to care for seriously ill family members, while 76% offered 12 weeks, and 13% offered more than 12 weeks.8 In a 2007 study by the Sloan Center on Aging & Work, “30.5% of participating employers reported that most/all of their full-time employees have the option of taking extended leave for caregiving. (p.16)…. “22.4% of the employers reported that they allow employees who are grandparents to access at least some employee benefits for the care that they provide to their grandchildren.”9 Ill health or disability Childcare, transportation or other problems 0% According to the 2008 National Study of Employers, 75 percent of employers say that they provide paid or unpaid time off for employees to provide elder care without jeopardizing their jobs. Another 31 percent provide employees with information about elder care services or Elder Care Resource and Referral and 23 percent offer Dependent Care Assistance Programs for elder care.8 10% 20% 30% 40% 50% *Includes: believes no work available, could not find work, lacks necessary schooling or training, employer thinks too young or old, and other types of discrimination. Source: Bureau of Labor Statistics (2008) In the same study, “Benefits related to caregiving responsibilities of employees that were offered by 20% or less of the organizations responding the survey include: pre-tax dependent care spending accounts (20.3%), long-term care insurance plan for employees’ parents (15.3%), reimbursement for dependent care when employee travels (12.8%), allowances/subsidies/vouchers for dependent care expenses (11.5%), and respite care (11.1%).9 References 1 MetLife. (2009). Boomer bookends: Insights into the oldest and youngest boomers. Westport, CT: MetLife Mature Market Institute. Retrieved from http://www. metlife.com/assets/cao/mmi/publications/studies/mmi-studies-boomer-bookends.pdf 2 ExperienceWorks. (2009). Overlooked and underserved: The crisis facing America’s older worker. Executive summary. Arlington, VA: ExperienceWorks. Retrieved from http://www.experienceworks.org/site/DocServer/EW-ExecSummary_09-Final. pdf?docID=10383 3 Hewlett, S. A., Jackson, M., Sherbin, L., Shiller, P., Sosnovich, E., & Sumberg, K. (2009). Bookend generations: Leveraging talent and finding common ground. New York: Center for Work-Life Policy. 6 7 MetLife Mature Market Institute, & National Alliance for Caregiving. (2006). The MetLife caregiving cost study: Productivity losses to U.S. businesses. Westport, CT: MetLife. Retrieved from http://www.caregiving.org/data/Caregiver%20Cost%20 Study.pdf Bureau of Labor Statistics. (2008) Household data annual averages. table 35. persons not in the labor force by desire and availability for work, age and sex. Retrieved June 3, 2008, from http://www.bls.gov/cps/cpsaat35.pdf 8 Galinsky, E., Bond, J. T., & Sakai, K. (2008). 2008 national study of employers. New York, NY: Families and Work Institute. Retrieved from http://familiesandwork. org/site/research/reports/2008nse.pdf 9 4 5 Sweet, S., & Joggerst, M. (2008). The interlocking careers of older workers and their adult children (Issue Brief No. 14). Chestnut Hill, MA: The Sloan Center on Aging and Work at Boston College. Retrieved from http://agingandwork.bc.edu/ documents/IB14_InterlockingCareers.pdf Pitt-Catsouphes, M., Smyer, M. A., Matz-Costa, C., & Kane, K. (2007). The national study report: Phase II of the national study of business strategy and workforce development (Research Highlight No. 04). Chestnut Hill, MA: The Center on Aging & Work/Workplace Flexibility. Retrieved August 22, 2007 from http://agingandwork.bc.edu/documents/RH04_NationalStudy_03-07_004.pdf Age Wave. (2009). Retirement at the tipping point: The year that changed everything. New fears, new hopes, and a new purpose for retirement. New York: Harris Interactive. Retrieved from http://www.agewave.com/RetirementTippingPoint.pdf 2 http://www.bc.edu/agingandwork
