Econ Honors: Midterm 1 (Anthony Yuen) October 13, 2007
advertisement
Econ Honors: Midterm 1 (Anthony Yuen)
October 13, 2007
Instructions:
• This is a 60-minute examination.
• Show all work. Use diagrams where appropriate and label all diagrams carefully.
• This exam is given under the rules of Penn's Honor system.
• The use of Programmable Calculators is in violation of Departmental rule. It is
strictly forbidden!
The Midterm has 2 parts.
Part 1 consists of 8 multiple-choice questions.
Part 2 consists of 2 short answer questions.
Write your
MC
answers in
the margin
Part I: Multiple Choice Questions (4 points each/32 points total):
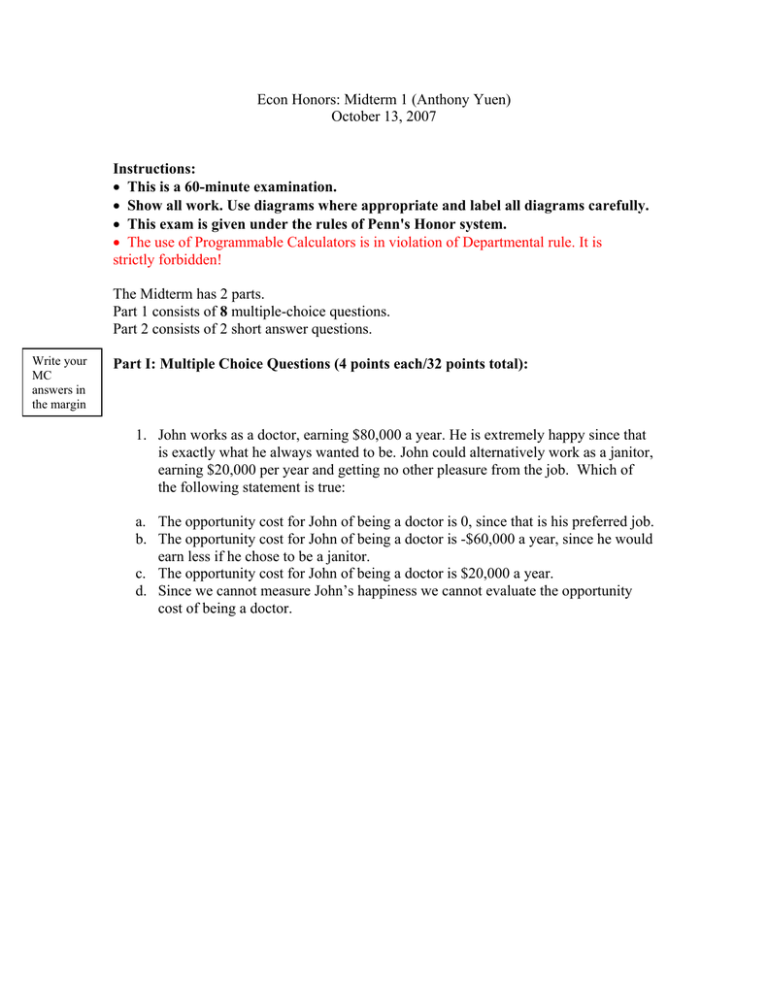
1. John works as a doctor, earning $80,000 a year. He is extremely happy since that
is exactly what he always wanted to be. John could alternatively work as a janitor,
earning $20,000 per year and getting no other pleasure from the job. Which of
the following statement is true:
a. The opportunity cost for John of being a doctor is 0, since that is his preferred job.
b. The opportunity cost for John of being a doctor is -$60,000 a year, since he would
earn less if he chose to be a janitor.
c. The opportunity cost for John of being a doctor is $20,000 a year.
d. Since we cannot measure John’s happiness we cannot evaluate the opportunity
cost of being a doctor.
2. Suppose that hot dogs and hamburgers are substitutes. Which of the following
could lead to a fall in the equilibrium quantity of hamburgers?
a. An increase in the price of spices that are only used in the production process
of hot dogs.
b. A technological improvement in the production of hot dogs.
c. An increase in the number of people who choose to take careers in the
hamburger making industry.
d. A successful advertising campaign for hamburgers.
3. The Annenberg Center is trying to maximize revenues for their performances.
Currently there are many empty seats and you are hired as a consultant on ticket
prices. You find that faculty members have an inelastic demand for the shows but
that student demand is elastic. You will recommend to:
a.
b.
c.
d.
Lower the price of tickets for faculty only.
Lower the price of tickets to students only.
Lower the price of tickets to both faculty and students.
Raise the price of tickets to both faculty and students.
4. Which of the following events NEVER triggers a shift in the demand for good X
in the usual supply and demand graph?
1. A change in individual’s income for a normal good.
2. A change in the price of good X
3. A change in the price of a substitute good when the demand for good x is
inelastic.
4. A change in the price of a complementary good and the demand for good X is
elastic.
No need to show your work for the following.
5. U.S.’s demand curve for grain is:
QD = 200 – 40P
Its supply curve is
QS = 40 + 40P
ROTW’s demand curve for grain is:
QD* = 160 – 40P
Its a supply curve is
QS* = 80 + 40P
What are the equilibrium quantities in the U.S. and ROTW if they don’t trade
with each other?
a.
b.
c.
d.
QUS = 60, QROTW = 120
QUS = 120, QROTW = 120
QUS = 60, QROTW = 240
QUS = 120, QROTW = 240
Honors Multiple Choice Questions:
6. Using the information in (5), now allow the U.S. and ROTW to trade with each
other, at zero transportation cost. What is the world price?
a.
b.
c.
d.
e.
$1.0
$1.2
$1.5
$1.8
$2.0
7. If Pf = 1 and Pc = 2, how much of (F) and (C) should a country produce, given a
PPF of:
QF = -QC2 + 3
a.
b.
c.
d.
QC = 1, QF = 1
QC = 1, QF = 2
QC = 2, QF = 1
QC = 2, QF = 2
8. Suppose a person has the following utility function:
max{Df, Dc}
a ln(Df) + b ln(Dc)
subject to:
PfDf + PcDc = V
What is the expression for an optimized Dc?
a.
b.
c.
d.
Dc = aV/(a+b)
Dc = bV/(a+b)
Dc = a/[(a+b)V]
None of the above
Part II: Short Answer Questions (68 points total):
Explain answers carefully using graphs where appropriate. Your grade depends on
your explanation as well as your answer: so show your work!
Q1. [34 points]
Suppose that Dubai can only produce two products: Software and Hotels. Suppose further
that it has two groups of residents, of equal size, Techies and Servers.
Their weekly productivities are given in the table below:
Software (units per week)
Hotel (units per week)
Techies
4
4
Servers
2
8
a. Draw Dubai’s weekly PPF with software on the horizontal axis.
b. Dubai currently produces 4 Hotel units. Assuming it is efficient, how many Software
units is it producing? Who is producing the Hotel units? Who is producing Software
units?
c. The world trade ratio is 4 units of Hotel for one Software unit. Add Dubai’s
Consumption Possibilities Curve to your graph in part a.
d. Is Dubai better off with trade? Explain.
e. Assume trade is no longer available.
Since jobs related to software development pay better, this created an income inequality
between Techies and Servers. To reduce this problem, Dubai established a training
program in software development. All Servers were required to attend and no Techies
were admitted.
As people differ in abilities to learn, the program was more useful for some than others.
So, now there are 2 types of Servers (each half the size of the original group) with
different weekly productivities as given below:
Software (units per week) Hotel (units per week)
More productive
2
4
Less Productive
1
4
Draw the new weekly PPF for Dubai below with software on the horizontal axis.
Q2: Grain Subsidy
Atlantis
Rest of the world
(ROTW)
P
P
Q
P*
Q*
Q*
1.
Draw the excess supply and excess demand curves with the correct intercepts. Label the world price
and world equilibrium quantity [8 points]
2.
Shade the consumer surplus in Atlantis and the producer surplus in ROTW [4 points]
3.
Suppose Atlantis apply an export subsidy. (a) Draw the appropriate curve, (b) shade the consumer
and producer surpluses in Atlantis and ROTW, and (c) draw the subsidy. [12 points]
4.
If ROTW seeks to “protect” their grain farmers, what could they do? Draw on the graph and briefly
discuss below (2 sentences max.) [4 points]
Atlantis
Rest of the world
(ROTW)
P
P
Q
P*
Q*
Q*
If instead of an export subsidy that is largely banded by the World Trade Organization, Atlantis subsidizes
the entire domestic grain industry.
1.
Shift the appropriate curve [2 points]
2.
Based on (1), draw the excess supply and excess demand curves [2 points]
3.
Label the correct world price and world quantity [2 points]
4.
Shade the consumer surplus and producer surplus in Atlantis [2 points]
5.
Draw the subsidy [2 points]
Answer key:
Regular section
1.
C
2.
B
3.
B
4.
B
Honors:
Part I: Multiple Choice
5. B
QD = 200 – 40P
QS = 40 + 40P
QD = QS
200 – 40P = 40 + 40P
160 = 80P
P=2
(Q = 120)
QD* = 160 – 40P
QS* = 80 + 40P
QD* = QS*
160 – 40P = 80 + 40P
80 = 80P
P=1
(Q = 120)
6. C
Method 1: Finding the world market equilibrium using the world supply and demand
QD + QD* = (200 – 40P) + (160 – 40P) = 360 – 80P
QS + QS* = (40 + 40P) + (80 + 40P) = 120 + 80P
QD + QD* = QS + QS*
360 – 80P = 120 + 80P
240 = 160P
P = 1.5
Method 2: Finding the world market equilibrium using excess supply and excess demand
Determine from the graphs which country has excess supply and which has excess demand
QExcess Supply = QES = QS* – QD* = (80 + 40P) – (160 – 40P) = –80 + 80P
QExcess Demand = QED = QD – QS = (200 – 40P) – (40 + 40P) = 160 – 80P
QES = QED
–80 + 80P = 160 – 80P
160P = 240
P = 1.5
7. B
Since Qc = Pc/(2Pf) = 2/(2x1) = 1,
then Qf = -Qc2 + 3 = 2.
8. D
None of the above because price is not in there. It should be:
Dc = aV/[(a+b)Pc]
Short Answer:
Q1.
Suppose that Dubai can only produce two products: Software and Hotels. Suppose further that it has two groups of residents, of equal
size, Techies and Servers.
Their weekly productivities are given in the table below:
Software (units per week)
Hotel (units per week)
Techies
4
4
Servers
2
8
a. Draw Dubai’s weekly PPF with software on the horizontal axis.
Answer:
Kinked ppf with points at (0, 12), (4,8), (6,0)
Points: 8
General shape:2
Each point: 2 points.
b. Dubai currently produces 4 Hotel units. Assuming it is efficient, how many Software units is it producing? Who is producing the
Hotel units? Who is producing Software units?
Answer: To get 4 Hotels Servers must be spending half their time on this job which leaves them time to make 1 unit of
software. Total Software is thus 4+1=5
Dubai is producing less than 8 hotels implying that Servers are producing both Hotels & Software, while Techies are
producing only software.
Points: 4
4 hotels, 5 software units: 2 points (1 for answer, 1 for explanation)
Hotels by Servers: 1 point
Software by Techies & servers: 1 point
c. The world trade ratio is 4 units of Hotel for one Software unit. Add Dubai’s Consumption Possibilities Curve to your graph in part a.
Answer:
It is a straight line from (6,0) to (0,24).
At this price ratio Techies will specialize in Software as they have lower opportunity cost for software than the international
price ratio. Servers have the same opportunity cost as the rest of the world which is why the CPF is the same as the PPF in part
of the region.
6*4=24.
Points: 8
Straight line: 1 points
Correct slope: 1 point
Starting at (6,0): 2 points
Ending at (0,24): 2 points
Making sure it is not inside PPF: 2 points
d. Is Dubai better off with trade? Explain.
6 points
We will accept 2 answers here:
1. No, as they prefer their original point (see partb) to any new possible point.
2. Yes, as now they can consume at points that were not possible before.
If just state: always gains from trade: 3 points
e. Assume trade is no longer available.
Since jobs related to software development pay better, this created an income inequality between Techies and Servers. To reduce this
problem, Dubai established a training program in software development. All Servers were required to attend and no Techies were
admitted.
As people differ in abilities to learn, the program was more useful for some than others. So, now there are 2 types of Servers (each half
the size of the original group) with different weekly productivities as given below:
More productive
Less Productive
Software (units per week)
2
1
Hotel (units per week)
4
4
Draw the new weekly PPF for Dubai with software on the horizontal axis.
Answer:
A ppf with 2 Kinks. Points at (0, 12), (4,8), (6,4), (7,0)
Points:8
General shape:4
Each point: 1 point.
Q2: Grain Subsidy
Atlantis
P
Rest of the world
(ROTW)
P
S
P*
S*
ES
Subtract this tra
for PS in (3)
ES with
subsidy
CS
Pw
ED
PS
D
)
D*
Q
Qw
Q*
Q*
1.
Draw the excess supply and excess demand curves with the correct intercepts. Label the world price
and world equilibrium quantity [8 points]
2.
Shade the consumer surplus in Atlantis and the producer surplus in ROTW [4 points]
3.
Suppose Atlantis apply an export subsidy. (a) Draw the appropriate curve, (b) shade the consumer
and producer surpluses in Atlantis and ROTW, and (c) draw the subsidy. [12 points]
4.
If ROTW seeks to “protect” their grain farmers, what could they do? Draw on the graph and briefly
discuss below (2 sentences max.) [4 points]
They could impose a tariff (ie, import tax) that is equal in amount to the subsidy given.
Atlantis
Rest of the world
(ROTW)
P
P
P*
CS
Pw
Subsidy
PS
Q
Qw
Q*
Q*
If instead of an export subsidy that is largely banded by the World Trade Organization, Atlantis subsidizes
the entire domestic grain industry.
1.
Shift the appropriate curve [2 points]
2.
Based on (1), draw the excess supply and excess demand curves [2 points]
3.
Label the correct world price and world quantity [2 points]
4.
Shade the consumer surplus and producer surplus in Atlantis [2 points]
5.
Draw the subsidy [2 points]
