Update on Response Rates for Online Student
advertisement
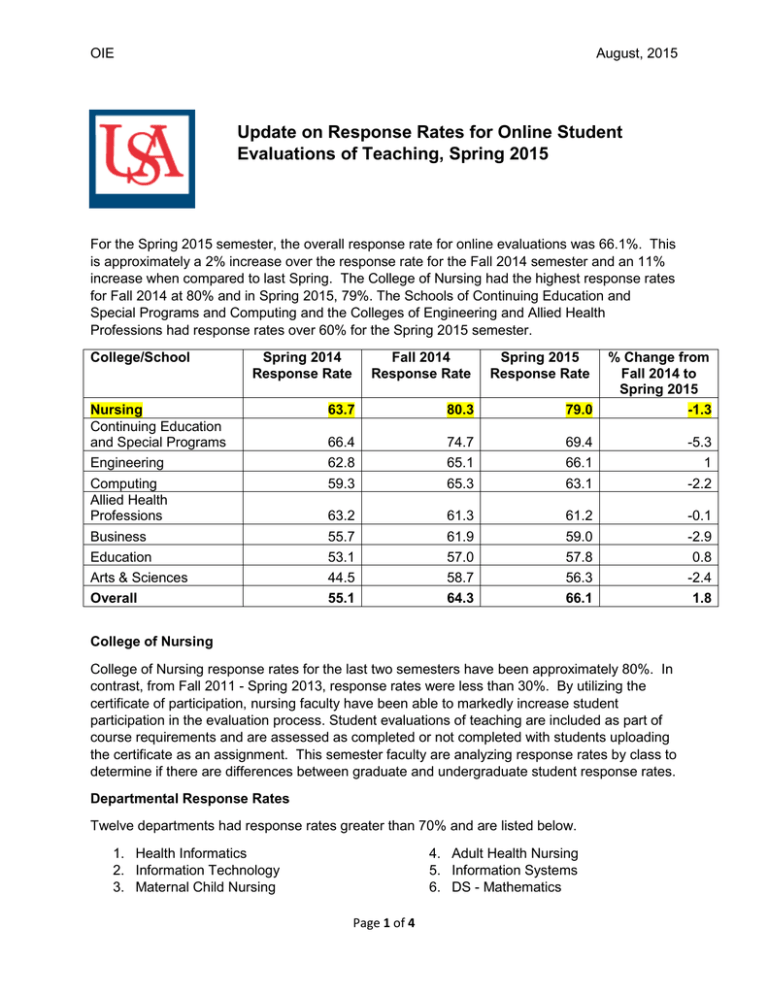
OIE August, 2015 Update on Response Rates for Online Student Evaluations of Teaching, Spring 2015 For the Spring 2015 semester, the overall response rate for online evaluations was 66.1%. This is approximately a 2% increase over the response rate for the Fall 2014 semester and an 11% increase when compared to last Spring. The College of Nursing had the highest response rates for Fall 2014 at 80% and in Spring 2015, 79%. The Schools of Continuing Education and Special Programs and Computing and the Colleges of Engineering and Allied Health Professions had response rates over 60% for the Spring 2015 semester. College/School Spring 2014 Response Rate Fall 2014 Response Rate Spring 2015 Response Rate 63.7 80.3 79.0 % Change from Fall 2014 to Spring 2015 -1.3 66.4 62.8 59.3 74.7 65.1 65.3 69.4 66.1 63.1 -5.3 1 -2.2 63.2 55.7 53.1 44.5 55.1 61.3 61.9 57.0 58.7 64.3 61.2 59.0 57.8 56.3 66.1 -0.1 -2.9 0.8 -2.4 1.8 Nursing Continuing Education and Special Programs Engineering Computing Allied Health Professions Business Education Arts & Sciences Overall College of Nursing College of Nursing response rates for the last two semesters have been approximately 80%. In contrast, from Fall 2011 - Spring 2013, response rates were less than 30%. By utilizing the certificate of participation, nursing faculty have been able to markedly increase student participation in the evaluation process. Student evaluations of teaching are included as part of course requirements and are assessed as completed or not completed with students uploading the certificate as an assignment. This semester faculty are analyzing response rates by class to determine if there are differences between graduate and undergraduate student response rates. Departmental Response Rates Twelve departments had response rates greater than 70% and are listed below. 1. Health Informatics 2. Information Technology 3. Maternal Child Nursing 4. Adult Health Nursing 5. Information Systems 6. DS - Mathematics Page 1 of 4 OIE August, 2015 7. Nursing 8. Accounting 9. Leadership and Teacher Education 10. Civil Engineering 11. Earth Sciences 12. Electrical Engineering Comparison of Response Rates for Online versus Paper Surveys Overall When comparing the response rates for paper and online surveys for Fall 2014 and Spring 2015, response rates for paper surveys were 3% higher for the Fall 2014 semester and in Spring, the differences was less than 1%. Comparison of Response Rates by Administration Modality, Fall 2014 and Spring 2015 Administration Modality Paper overall Electronic overall Enrollment Fall 2014 Participants Spring 2015 Fall 2014 Spring 2015 Response Rate Fall 2014 Spring 2015 14,084 12,178 9,499 8,158 67.4% 67.0% 43,771 56,030 28,140 37.257 64.3% 66.1% In addition, both Nursing and Continuing Education had overall response rates higher than the overall response rate for paper surveys for both semesters. Departmental Comparisons College of Arts and Sciences departments, Biology and Earth Sciences switched to online evaluations for the 2014-15 academic year. For Earth Sciences, semester response rate are relatively consistent when comparing 13-14 (paper administration) to 14-15 (electronic administration) remained relatively consistent. In the case of Biology, Fall-to-Fall comparisons were relatively consistent. The response rate for Spring 2015 was approximately 12% lower when compared to Spring 2014. Paper Online Department Fall 2013 Spring 2014 Fall 2014 Spring 2015 Earth Sciences 73.9% 77.3% 74.3% 77.9% Biology 66.2% 73.1% 63.8% 61.5% Chemistry and Physics labs moved to online evaluations during the Fall 2014 with the lecture component of the course continuing to use paper surveys. Response rates for Chemistry labs were higher when compared to in-class paper survey administration. However, the response rates for Physics labs were significantly lower when compared to the response rates for the lecture component of the courses for both semesters. Page 2 of 4 OIE August, 2015 Lecture Lab Department Fall 2014 Spring 2015 Fall 2014 Spring 2015 Chemistry 63.2% 47.7% 64.9% 50.7% Physics 65.1% 72.8% 54.7% 50.2% College/School Participation As of Spring 2015, the majority of colleges/schools are conducting student evaluations of teaching via email or accessing surveys through SAKAI. The exceptions are listed below and not included as part of this analysis. College of Allied Health Professions – Modality is listed by department 1. Radiologic Sciences – paper 4. Physical Therapy – online, in2. Cardiorespiratory Care – online, class in-class 5. Physician Assistant Studies – 3. Occupational Therapy – online, online, in-class in-class College of Arts and Sciences – Paper surveys, except for online and blended courses 1. 2. 3. 4. Chemistry lecture Communication English* Foreign Languages and Literatures 5. Interdisciplinary Programs 6. 7. 8. 9. Music Philosophy Physics lecture Political Science and Criminal Justice 10. Theatre and Dance *English began administering surveys online in the summer. School of Continuing Education and Special Programs – Paper Surveys 1. English as a Second Language (noncredit courses, only)* *ESL began administering surveys online in the summer. Conclusion Data reveal that it is possible to achieve acceptable response rates for online student evaluations of teaching which are comparable to in-class survey administration. OIE recommends that deans and faculty continue to promote participation in student evaluations of teaching, utilizing the Class Climate features such as participation tracking, certificates of completion and periodic response rate updates from the Office of Institutional Effectiveness (OIE) throughout the evaluation cycle. In addition, faculty now receive an email from Class Climate after week one of the evaluation cycle if their course(s) response rate is/are less than 50%. OIE continues to monitor response rates, keeping deans and faculty abreast of overall semester-to-semester response rates. Page 3 of 4 OIE August, 2015 Continuous Improvement In conjunction with the Computer Services Center, OIE continues to address problems related to the administration of electronic surveys. OIE monitors the Class Climate administrator email account throughout the evaluation period and provides assistance for any problems related to the evaluations. In addition, OIE works with the ILC to ensure timely announcements are posted in SAKAI throughout the evaluation period. Page 4 of 4
