Sales Increased and Average Prices Remained Almost Level
advertisement
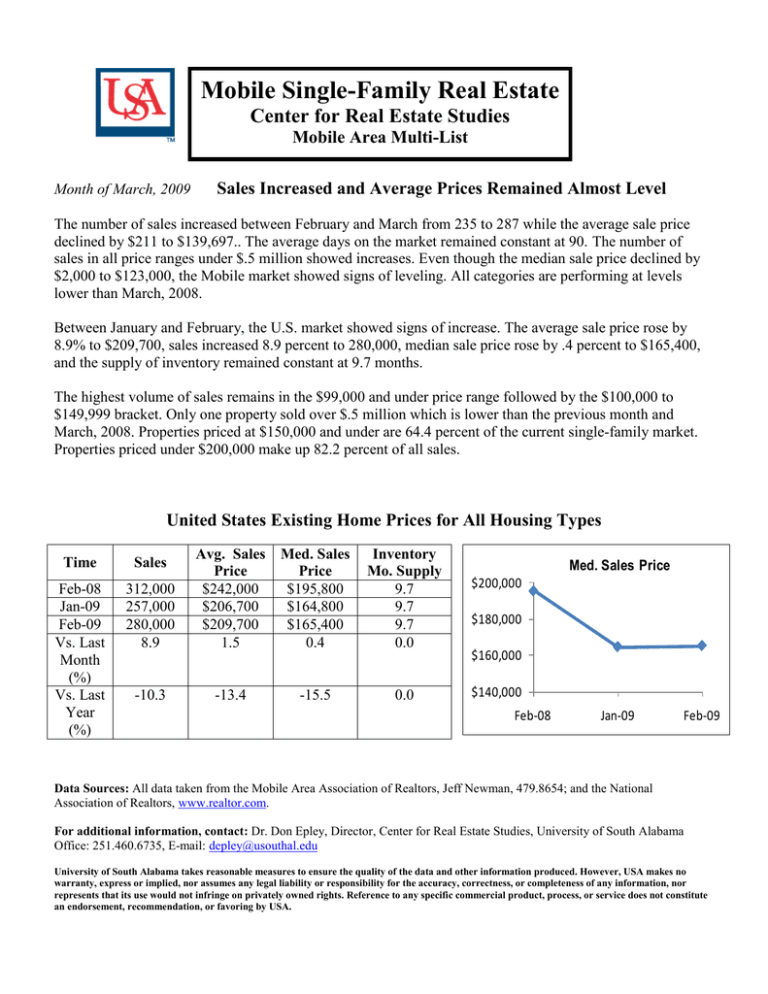
Mobile Single-Family Real Estate Center for Real Estate Studies Mobile Area Multi-List Month of March, 2009 Sales Increased and Average Prices Remained Almost Level The number of sales increased between February and March from 235 to 287 while the average sale price declined by $211 to $139,697.. The average days on the market remained constant at 90. The number of sales in all price ranges under $.5 million showed increases. Even though the median sale price declined by $2,000 to $123,000, the Mobile market showed signs of leveling. All categories are performing at levels lower than March, 2008. Between January and February, the U.S. market showed signs of increase. The average sale price rose by 8.9% to $209,700, sales increased 8.9 percent to 280,000, median sale price rose by .4 percent to $165,400, and the supply of inventory remained constant at 9.7 months. The highest volume of sales remains in the $99,000 and under price range followed by the $100,000 to $149,999 bracket. Only one property sold over $.5 million which is lower than the previous month and March, 2008. Properties priced at $150,000 and under are 64.4 percent of the current single-family market. Properties priced under $200,000 make up 82.2 percent of all sales. United States Existing Home Prices for All Housing Types 312,000 257,000 280,000 8.9 Avg. Sales Price $242,000 $206,700 $209,700 1.5 Med. Sales Price $195,800 $164,800 $165,400 0.4 Inventory Mo. Supply 9.7 9.7 9.7 0.0 -10.3 -13.4 -15.5 0.0 Time Sales Feb-08 Jan-09 Feb-09 Vs. Last Month (%) Vs. Last Year (%) Med. Sales Price $200,000 $180,000 $160,000 $140,000 Feb-08 Jan-09 Feb-09 Data Sources: All data taken from the Mobile Area Association of Realtors, Jeff Newman, 479.8654; and the National Association of Realtors, www.realtor.com. For additional information, contact: Dr. Don Epley, Director, Center for Real Estate Studies, University of South Alabama Office: 251.460.6735, E-mail: depley@usouthal.edu University of South Alabama takes reasonable measures to ensure the quality of the data and other information produced. However, USA makes no warranty, express or implied, nor assumes any legal liability or responsibility for the accuracy, correctness, or completeness of any information, nor represents that its use would not infringe on privately owned rights. Reference to any specific commercial product, process, or service does not constitute an endorsement, recommendation, or favoring by USA. March 2009 Mobile County Single-Family Residential Report Average Sales Price $150,000 Median Sales Price $134,000 $148,000 $132,000 $146,000 $130,000 $144,000 $128,000 $142,000 $126,000 $140,000 $124,000 $138,000 $122,000 $136,000 $120,000 $134,000 $118,000 Mar-06 Mar-07 Mar-08 Feb-09 vs. Last Year (%) Mar-09 Mar-06 vs. Last Month (%) Mar-07 Mar-08 Feb-09 vs. Last Year (%) Month Ave. Sales $ Mar-06 $144,788 Mar-07 $147,901 2.15 Mar-07 $129,900 3.92 Mar-08 $147,732 -0.11 Mar-08 $133,000 2.39 Feb-09 $139,908 Feb-09 $125,000 Mar-09 $139,697 Mar-09 $123,000 Annual 07 Annual 08 $158,885 $153,089 Annual 07 Annual 08 $135,702 $133,850 -0.15 -3.65 Number of Sales 600 Month Med. Sales $ Mar-06 $125,000 vs. Last Month (%) -1.60 -1.36 Average Days on Market 100 500 Mar-09 80 400 60 300 40 200 100 20 0 0 Mar-06 Month Mar-07 # Sales Mar-08 Feb-09 vs. Last Year (%) Mar-09 Mar-06 vs. Last Month (%) Mar-07 Mar-08 Month Ave. Days on Mkt Feb-09 vs. Last Year (%) Mar-06 490 Mar-06 67 Mar-07 468 -4.49 Mar-07 68 1.49 Mar-08 361 -22.86 Mar-08 83 22.06 Feb-09 235 Feb-09 90 Mar-09 287 Mar-09 90 Annual 07 5097 Annual 07 66 Annual 08 4106 Annual 08 85 22.13 -19.44 Mar-09 vs. Last Month (%) 0.00 28.79 Month 0-$99,999 $100,000$149,999 $150,000$199,999 $200,000$299,999 $300,000$499,999 Ov er $5 Mar-06 161 174 77 51 20 7 Mar-07 145 163 67 66 21 5 Mar-08 117 103 69 46 22 4 Feb-09 87 64 43 33 6 2 Mar-09 101 81 54 32 17 1 Ann. 07 1389 1605 1006 742 271 89 Ann. 08 1248 1234 764 588 204 71 Number Price Range of Sales 200 180 160 140 120 100 80 60 40 20 0 Mar-06 Mar-07 Mar-08 Feb-09 Mar-09
