1 Agenda: STAT 401 Week 5 Lab 2
advertisement
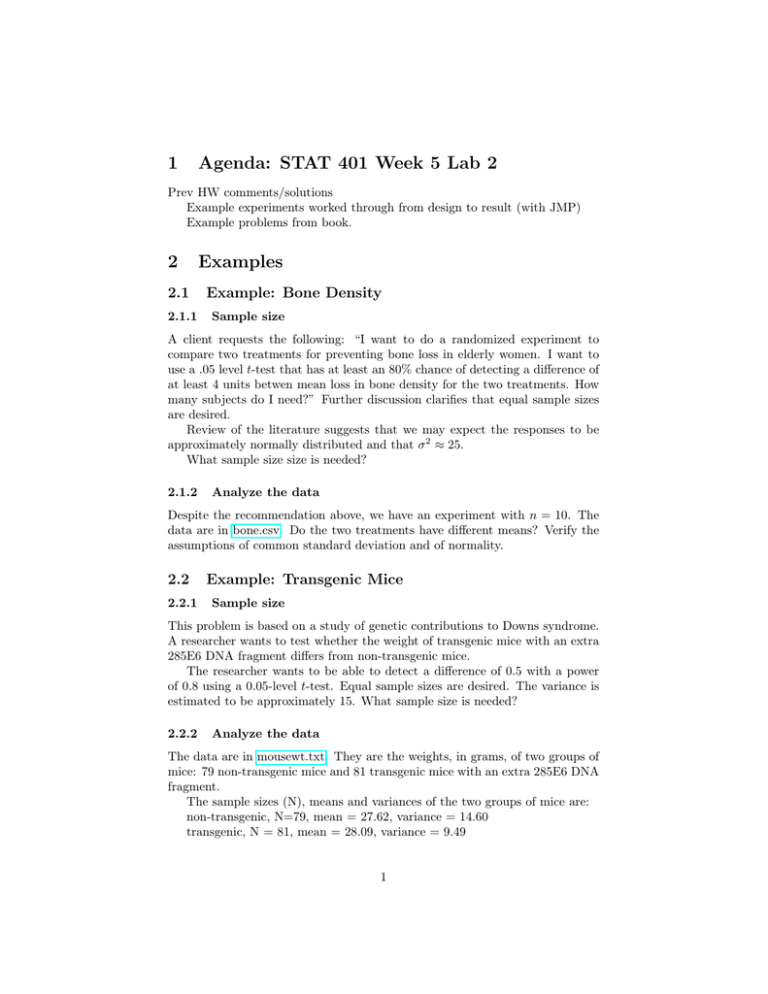
1 Agenda: STAT 401 Week 5 Lab 2 Prev HW comments/solutions Example experiments worked through from design to result (with JMP) Example problems from book. 2 2.1 2.1.1 Examples Example: Bone Density Sample size A client requests the following: “I want to do a randomized experiment to compare two treatments for preventing bone loss in elderly women. I want to use a .05 level t-test that has at least an 80% chance of detecting a difference of at least 4 units betwen mean loss in bone density for the two treatments. How many subjects do I need?” Further discussion clarifies that equal sample sizes are desired. Review of the literature suggests that we may expect the responses to be approximately normally distributed and that σ 2 ≈ 25. What sample size size is needed? 2.1.2 Analyze the data Despite the recommendation above, we have an experiment with n = 10. The data are in bone.csv. Do the two treatments have different means? Verify the assumptions of common standard deviation and of normality. 2.2 2.2.1 Example: Transgenic Mice Sample size This problem is based on a study of genetic contributions to Downs syndrome. A researcher wants to test whether the weight of transgenic mice with an extra 285E6 DNA fragment differs from non-transgenic mice. The researcher wants to be able to detect a difference of 0.5 with a power of 0.8 using a 0.05-level t-test. Equal sample sizes are desired. The variance is estimated to be approximately 15. What sample size is needed? 2.2.2 Analyze the data The data are in mousewt.txt. They are the weights, in grams, of two groups of mice: 79 non-transgenic mice and 81 transgenic mice with an extra 285E6 DNA fragment. The sample sizes (N), means and variances of the two groups of mice are: non-transgenic, N=79, mean = 27.62, variance = 14.60 transgenic, N = 81, mean = 28.09, variance = 9.49 1 1. Create a normal probability plot for each group. Are the weights normally distributed? 2. Calculate the standard deviation and coefficient of variation for both groups of mice. Which group is more variable? 3. Calculate the standard error of the mean weight for each group of mice. 4. Test whether the two group variances are the same. 5. Calculate the pooled estimate of the standard deviation. 6. How many degrees of freedom are associated with the pooled estimate of sd? 7. Calculate the se of the difference between the two means. 8. Do the two groups have different means? 2.3 Example: Schizophrenia Data An experiment examined maternal twins where one twin has schizophrenia and the other is unaffected. The data for the experiment are in schizophrenia.txt. The response variable is the volume of the hippocampus. The researchers were interested in whether the volume differed. Verify any assumptions needed to answer the question. 3 Book Problems Ch 9: 10, 13, 41, 53, 71, 4 References • STAT 401 Page 2


