RESEARCH LABORATORY ELECTRONICS The of
advertisement

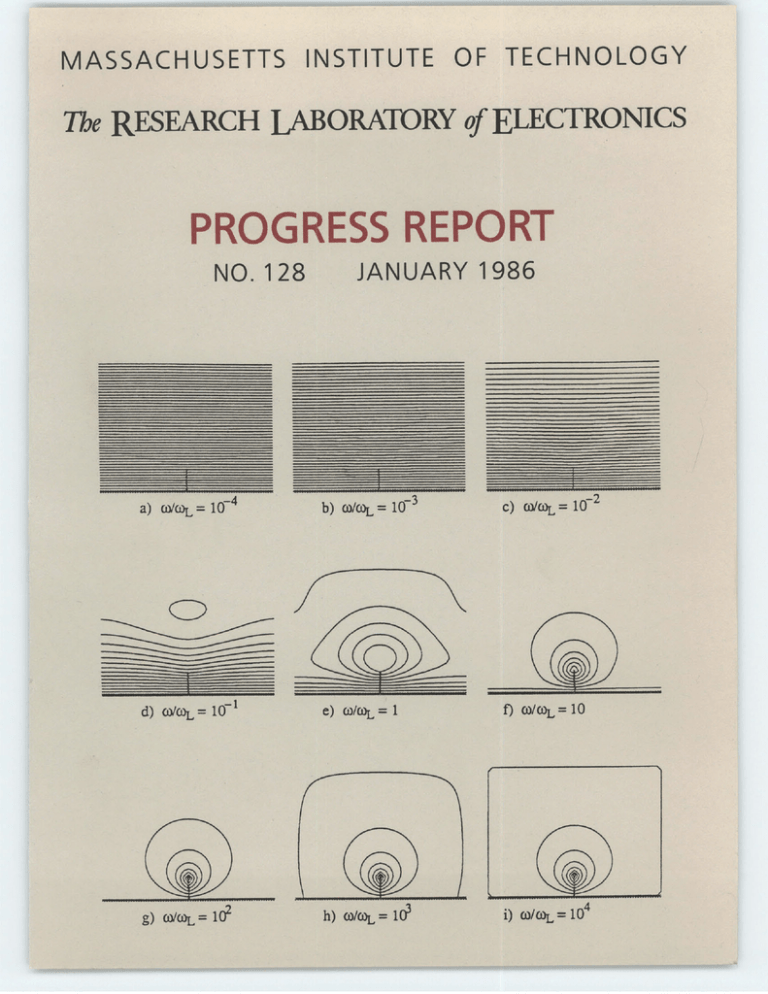
MASSACHUSETTS INSTITUTE OF TECHNOLOGY The RESEARCH LABORATORY of ELECTRONICS NO. 128 JANUARY 1986 i- -I -- Massachusetts Institute of Technology RESEARCH LABORATORY OF ELECTRONICS RLE PROGRESS REPORT No. 128 January 1986 Submitted by: J. Allen R. Birgeneau c©Massachusetts institute of Technology 1986 All rights reserved Cover: The mechanically sensitive cells (hair cells) of the fluid-filled inner ear contain microscopic sensory hairs that vibrate when the ear is stimulated by sound. This vibration is transduced by the hair cells to produce activity in nerve fibers which carry the information about the sound stimulus to the brain. The mechanisms underlying the coding of sounds into nerve messages are currently under investigation in RLE (see section 18.1.3., p. 101). The figure on the cover illustrates results from a computational study of simple structures vibrating in fluid; a study designed to determine the effects of fluids on the vibration of the sensory hairs of hair cells. The fluid motion that is induced by sinusoidal translation of a rigid structure (that consists of an infinite flat plate from which a rectangular flap projects ) is illustrated by streamlines (drawn parallel to the direction of fluid motion with a density that is proportional to the magnitude of fluid velocity). Each panel illustrates the numerical solution of the equations of motion of the fluid for a particular frequency of vibration; lowest frequency in the upper left panel and highest frequency in the lower right panel. Freeman, D.M., "Hydrodynamic Study of Stereociliary Tuft Motion in Hair Cell Organs, " Ph.D. Thesis, Department of Electrical Engineering and Computer Science, M.I.T., May 1986. This report No. 128 in a series of Progress Reports issued by the Research Laboratory of Electronics, contains the annual statement of research objectives and summary of research for each group. The report covers the period January 1, 1985-December 31, 1985, and the source of support is indicated for each project. On the masthead of each section are listed the academic and research staff and the graduate students who participated in the work of the group during the year. The listing of personnel in the back of the book includes only members of the laboratory during 1985. List of Figures Figure 1 0-1: Relaxed surface total energy per 2x2 unit cell as a function of the position on the z-axis of the symmetry breaking atom. Figure 1 0-2: Total energy per 2x2 unit cell of various reconstruction models for the (111) surface of GaAs. Figure 2_0-1: (a) The signal from a high sensitivity probe (3 tm I.D., 8 jm O.D., membrane thickness < 0.5 [Lm). The probe is exposed to either normal water (H2018 isotopic abundance = 0.2%) or to water containing 1.5% H2018. Figure Figure Figure Figure Figure Figure Figure Figure Figure Figure Figure Figure Figure (b) Test with Nuclepore membrane, pore diameter = 12 im. The signal is from the above probe. It is placed alternately above a pore or 15 pm from a pore. The average distance of the probe above the Nuclepore is 3 /m. H20 18 flows from below at 1 x 10- 9 I/sec. (c) Concentration profile above single pore. The position is the horizontal distance between the probe center and the pore center. Each point is the average of 2 measurements made on opposite sides of the pore. 2:0-2: Ion Microprobe Analysis (IMA) results of Tsuru and Latanision, Reference 1. (a) IMA data showing the increased hydrogen concentration at grain boundaries on the exit surface of a nickel specimen cathodically charged for 2 hours at the opposite or entry surface (cathode). (b) IMA scanning direction superimposed on the optical micrograph of the surface corresponding to Fig. 20-2a. The hydrogen peaks in Fig. 20-2a correspond to grain boundary intersections. 20-3: Fast crack growth of high-strength steel in water and hydrogen, but crack arrest in oxygen (after Hancock and Johnson). 3 20-4: Ionizer and Sample. Field-ionizing tungsten tip approximately 0.1 pm in radius which can be scanned in a plane 1 [m from and parallel to the sample surface. Ions formed near the upper quadrant of the tip will strike the sample, producing sputtering that is entirely negligible, whereas ions formed in the lower quadrant will be detected. 20-5: Sample and Detector Assembly 22-1: Cascade fluorescence (2p -- 2s) rate versus ring laser frequency. The two peaks reflect the hyperfine structure of the 3 2S,, and 22S1/2 states of lithium 7. 22-2: Electric field ionization rate versus linear laser frequency. The HWHM linewidth is 28 MHz. Time-of-flight data for inhibited 22-3: Inhibited spantaneous emission. emission (X/2d > 1, curve B) and enhanced emission (X/2d < 1, curve A). 22-4: FFT of current density vs. frequency for 4 seconds of data collection. 22-5: The longitudinal magnetic field and the atomic and laser beams configuration. Atoms whose energy increases with increasing magnetic field can be trapped near 225 cm. 22-6: (a) Diffractive Regime, (b) Diffusive Regime V. jf for Li 2-Xe,u = = + v 22-7: Rate constant k.= 4,j 44 if f -2,-1, + 1, + 2 collisions. . vs. j for Li -Xej = 14, 28, 44 collisions. 22-8: Rate constant k Cross 4,sections vs for L-Xe at 4 values of 22-9: Cross sections d , = 19, j, 42f-- Pf 8,jfvs. jf for Li2-Xe at 4 values of 56 57 132 134 135 136 137 145 146 148 150 151 153 154 154 155 RLE P.R. 128 relative velocity. Figure 22-10: Results of trajectory calculations of Li - Ne collisions plotted with one dot at the outcome of each trajectory (Ajvs.Av plane) for Ji = 42,vr= .97. Figure 22-1 1: Results of trajectory calculations of Li -Ne collisions plotted with one dot at the outcome of each trajectory (Aj vs. Av plane) for Ji = 60, L = .97. Figure 22-12: Results of trajectory calculations of l.i-Ne collisions plotted with one dot at the outcome of each trajectory (A/vs. Av plane) fori = 60,v = 155 156 156 .5. Figure 27-1: Focusing at Depth: Fallacy of Maximum Intensity at Focus in a Lossy Medium. a) Geometry, b) Power Gain Over Uniform Plane Wave, c) Relative Power Density Figure 27-2: Experimental Linear Troughguide Set-Up Figure 27-3: Asymmetric Troughguide with Alternating Base Block Asymmetries, H-Field Loops, 1, and E-Field Probes, 2. Figure 27-4: Asymmetric Troughguide: Typical Element Geometry. RLE P.R. 128 215 217 217 217


