Table of Contents
advertisement
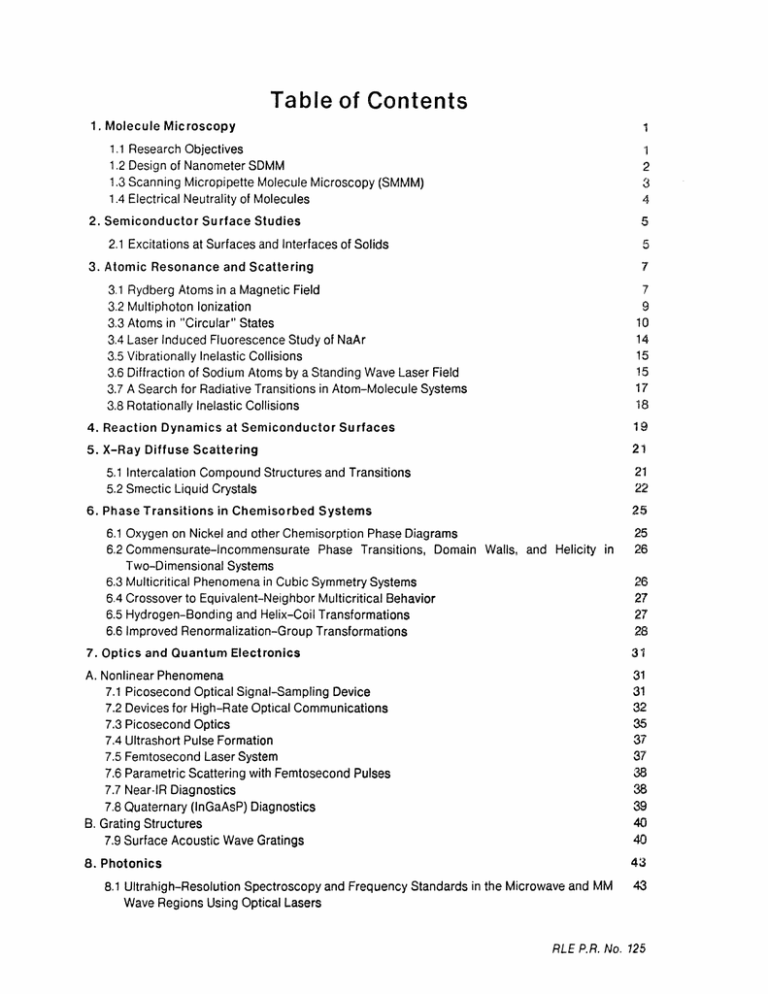
Table of Contents 1. Molecule Microscopy 1.1 1.2 1.3 1.4 1 Research Objectives Design of Nanometer SDMM Scanning Micropipette Molecule Microscopy (SMMM) Electrical Neutrality of Molecules 1 2 3 4 2. Semiconductor Surface Studies 5 2.1 Excitations at Surfaces and Interfaces of Solids 5 3. Atomic Resonance and Scattering 3.1 3.2 3.3 3.4 3.5 3.6 3.7 3.8 7 7 9 10 14 15 15 17 18 Rydberg Atoms in a Magnetic Field Multiphoton Ionization Atoms in "Circular" States Laser Induced Fluorescence Study of NaAr Vibrationally Inelastic Collisions Diffraction of Sodium Atoms by a Standing Wave Laser Field A Search for Radiative Transitions in Atom-Molecule Systems Rotationally Inelastic Collisions 4. Reaction Dynamics at Semiconductor Surfaces 19 5. X-Ray Diffuse Scattering 21 21 22 5.1 Intercalation Compound Structures and Transitions 5.2 Smectic Liquid Crystals 6. Phase Transitions in Chemisorbed Systems 25 6.1 Oxygen on Nickel and other Chemisorption Phase Diagrams 6.2 Commensurate-Incommensurate Phase Transitions, Domain Walls, and Helicity in Two-Dimensional Systems 6.3 Multicritical Phenomena in Cubic Symmetry Systems 6.4 Crossover to Equivalent-Neighbor Multicritical Behavior 6.5 Hydrogen-Bonding and Helix-Coil Transformations 6.6 Improved Renormalization-Group Transformations 25 26 26 27 27 28 7. Optics and Quantum Electronics 31 A. Nonlinear Phenomena 7.1 Picosecond Optical Signal-Sampling Device 7.2 Devices for High-Rate Optical Communications 7.3 Picosecond Optics 7.4 Ultrashort Pulse Formation 7.5 Femtosecond Laser System 7.6 Parametric Scattering with Femtosecond Pulses 7.7 Near-IR Diagnostics 7.8 Quaternary (InGaAsP) Diagnostics B. Grating Structures 7.9 Surface Acoustic Wave Gratings 31 31 32 35 37 37 38 38 39 40 40 8. Photonics 43 8.1 Ultrahigh-Resolution Spectroscopy and Frequency Standards in the Microwave and MM Wave Regions Using Optical Lasers 43 RLE P.R. No. 125 8.2 Resonant Light Diffraction by an Atomic Beam 8.3 Precision Atomic Beam Studies of Atom-Field Interactions 8.4 Measurement of Natural Predissociation Effects in Iodine Molecules 8.5 Passive Ring Resonator Method for Sensitive Inertial Rotation Measurements in Geophysics and Relativity 8.6 Closed Loop. Low Noise Fiberoptic Rotation Sensor 8.7 Fiberoptic Ring Resonator Gyroscope 44 45 46 46 47 48 9. Optical Spectroscopy of Disordered Materials and X-Ray Scattering from Surfaces 49 10. Infrared Nonlinear Optics 53 10.1 Infrared Nonlinear Processes in Semiconductors 11. Quantum Optics and Electronics 11.1 Nonlinear Optical Interactions in Semiconductors 11.2 Picosecond Dye Laser Optics 11.3 Nonlinear Spectroscopy of Atoms and Molecules 12. Microwave and Millimeter Wave Techniques 12.1 Cooled FET Amplifiers at 8 and 15 GHz 13. Microwave and Quantum Magnetics 13.1 Millimeter Wave Magnetics 13.2 New Techniques to Guide and Control Magnetostatic Waves 13.3 Optical and Inductive Probing of Magnetostatic Resonances 13.4 Magnetostatic Wave Dispersion Theory 13.5 Magnetoelastic Waves and Devices 13.6 Microwave Hyperthermia Group 13.7 Design of Planar Arrays 14. Radio Astronomy 14.1 Microwave Spectroscopy of the Interstellar Medium 14.2 Galactic and Extragalactic Radio Astronomy 14.3 Interacting Galaxies 14.4 The 6 cm Radio Survey 14.5 Morphology and Optical Identifications 14.6 Interstellar Masers 14.7 VLBI Studies 14.8 Planned Program, 1983-84 14.9 Jovian Decametric Radiation 14.10 Long-Baseline Astrometric Interferometer 14.11 Tiros-N Satellite Microwave Sounder 14.12 Improved Microwave Retrieval Techniques 14.13 Scanning Multi-Channel Microwave Radiometer (SMMR) 14.14 Video-Bandwidth Compression Techniques 14.15 Communications Satellites 14.16 Electrostatically-Figured Membrane Reflector 15. Electromagnetic Wave Theory and Remote Sensing 15.1 Electromagnetic Waves 15.2 Remote Sensing with Electromagnetic Waves RLE P.R. No. 125 53 55 55 56 56 59 59 63 63 64 64 65 65 66 66 69 69 70 71 71 71 72 72 73 74 75 75 76 77 77 78 78 81 81 81 15.3 Acoustic Wave Propagation Studies 15.4 Remote Sensing of Vegetation and Soil Moisture 15.5 Passive Microwave Snowpack Experiment 15.6 Remote Sensing of Earth Terrain 82 82 82 83 16. Electronic Properties of Amorphous Silicon Dioxide 17. Photon Correlation Spectroscopy and Applications 87 89 17.1 Research Program 89 18. Submicron Structures Fabrication and Research 91 18.1 Submicron Structures Lab 18.2 Microstructure Fabrication at Linewidths of 0.1 tLm and Below 18.3 Reactive Sputter Etching Studies 18.4 Electronic Conduction in Ultra-Narrow Silicon Inversion Layers 18.5 Corrugated-Gate MOS Structures 18.6 Graphoepitaxy of Si and Model Materials 18.7 Zone Melting Recrystallization of Si for Solar Cells 18.8 Zone Melting Recrystallization of InSb and InP 18.9 Submicrometer-Period Gold Transmission Gratings and Zone Plates for X-Ray Spectroscopy and Microscopy 18,10 High Dispersion, High Efficiency Transmission Gratings for Astrophysical X-Ray Spectroscopy 18.11 Switchable Zero-Order Diffraction Gratings as Light Valves 18.12 Filters Based on Conversion of Surface Acoustic Waves to Bulk Plate Modes in Gratings 18.13 Collaborative Projects 19. Plasma Dynamics 20.1 Atmospheric Optical Communication Systems for Network Environments 20.2 Atmospheric Propagation Effects on Infrared Radars 20.3 Improved Millimeter-Wave Communication Through Rain 20.4 Two-Photon Coherent State Light 20.5 Fiber-Coupled External-Cavity Semiconductor High-Power Laser 21. Digital Signal Processing Group 96 96 97 97 101 19.1 Relativistic Electron Beams and Generation of Coherent Electromagnetic Radiation 19.2 Nonlinear Wave Interactions-RF Heating and Current Generation in Plasmas 19.3 Tokamak Research: RF Heating and Current Drive 19.3.1 Top Launching Experiments 19.3.2 Particle Confinement 19.3.3 Versator Upgrade 19.3.4 S-Band Current Drive Experiment 19.3.5 Tail Mode Instability 19.3.6 Ion Heating 19.3.7 Diagnostic Experiments 19.3.8 UV and Visible Diagnostics 19.3.9 Thomson Scattering 19.3.10 X-Ray Measurements 19.4 Physics of Thermonuclear Plasmas 20. Optical Propagation and Communication 91 92 92 93 94 94 95 95 95 101 107 112 113 117 119 119 120 121 122 122 122 123 124 127 127 128 129 129 130 133 RLE P.R. No. 125 21.1 Introduction 21.2 Parabolic Wave Equation Modeling for Underwater Acoustics 21.3 Adaptive Image Restoration 21.4 Signal Reconstruction from Partial Fourier Domain Information 21.5 Knowledge-Based Pitch Detection 21.6 Multi-Dimensional High-Resolution Spectral Analysis and Improved Maximum Likelihood Method 21.7 Processing and Inversion of Arctic Refraction Data 21.8 Signal Estimation from Modified Short-Time Fourier Transform 21.9 Speech Enhancement Using Adaptive Noise Cancelling Algorithms 21.10 Overspecified Normal Equations for Autoregressive Spectral Estimation 21.11 Spectral Analysis Methods for Non-Stationary Time Series 21.12 Speech Coding Using the Phase of the Long-Time LPC Residual Signal 21.13 The Numerical Synthesis and Inversion of Acoustic Fields Using the Hankel Transform with Application to the Estimation of the Plane Wave Reflection Coefficient of the Ocean Bottom 21.14 Optimal Signal Reconstruction and ARMA Model Identification Given Noisy and Incomplete Observation Data 21.15 The Use of Speech Knowledge in Speech Enhancement 21.16 Estimation of the Degree of Coronary Stenosis Using Digital Image Processing Techniques 21.17 Automatic Target Detection in Aerial Reconnaissance Photographs 21.18 Enhancement of Helium-Degraded Speech 21.19 Facial Parameterization for Low Bit Rate Video Conferencing 21.20 Bottom Profile Determination in a Shallow Ocean 22. Speech Communication 22,1 Speech Recognition 22.1.1 Phonological Properties of Large Lexicons 22.1.2 Lexical Access 22.1.3 Acoustic Cues for Word Boundaries 22.1.4 Speaker-Independent, Continuous Digit Recognition 22.1.5 LAFS Recognition Model 22.1.6 Interactive Speech Research Facilities 22.2 Auditory Models and Analysis Techniques 22.3 Speech Synthesis 22.4 Physiology of Speech Production 22.5 Acoustics of Speech Production 22.6 Speech Production Planning 22.7 Studies of Acoustics and Perception of Speech Sounds 22.8 Speech Processing in Children and Older Subjects 133 136 137 137 138 139 140 141 142 142 143 144 144 145 146 147 148 149 149 150 151 152 152 153 154 155 155 155 156 156 157 158 159 160 161 23. Linguistics 163 24. Cognitive Information Processing 165 24.1 Picture Coding 24.2 Digital Wirephoto 2 System 24.3 Graphic Arts Applications 26Trademark of the A.P. RLE P.R. No. 125 165 167 24.4 Automated Engraving of Gravure Printing 168 25. Custom Integrated Circuits 171 25.1 Conversion of Algorithms to Custom Integrated Circuits 25.2 A Circuit Theory for Digital VLSI Systems 25.3 Very Large Scale Integrated Circuit Research 171 175 176 26. Communications Biophysics 179 A.Signal Transmission in The Auditory System 26.1 Basic and Clinical Studies of the Auditory System B. Auditory Psychophysics and Aids for the Deaf 26.2 Intensity Perception and Loudness 26.3 Hearing Aid Research 26.4 Tactile Perception of Speech 26.5 Discrimination of Spectral Shape by Impaired Listeners C. Transduction Mechanisms in Hair Cell Organs 26.6 Evidence of Length-Dependent Mechanical Tuning of Hair Cell Stereociliary Bundles in the Alligator Lizard Cochlea: Relation to Frequency Analysis 179 179 181 181 182 186 187 190 190 27. Physiology 193 28. Publications and Reports 195 28.1 Meeting Papers Presented 28.2 Journal Papers Published 28.3 Journal Papers Accepted for Publication 28.4 Letters to the Editor Published 28.5 Letters to the Editor Accepted for Publication 28.6 Special Publications 28.7 Technical Reports Published 195 209 212 213 215 215 215 29. Personnel 217 30. Research Support Index 225 RLE P.R. No. 125 List of Figures Figure 3-1: Two-Photon Resonance in Lithium 8 Figure 3-2: The cross section for 4 photon ionization of atomic hydrogen as calculated by 10 Reinhardt for a single frequency laser. To facilitate comparison, the cross section has been divided by 13. As the intensity increases, the peaks shift to the blue and become broader. Figure 3-3: Ionization profiles produced by laser intensity 10and at five times that intensity 11 510. As the laser intensity is increased, the ionization profile becomes broad and asymetric and is shifted to the blue of threshold. Figure 3-4: Schematic diagram of the excitation process, illustrated with hydrogen, n = 12 4. a) (above) Energy levels in an electric field, neglecting the second order Stark effect. The bold arrows show the excitation path used to populate the circular state, Iml = 3; the light arrows show an alternative excitation route; the dashed arrows show "leakage" transitions which must be avoided. b) (below) The progression of n1 = 0 levels in a decreasing field, with the second order Stark effect exaggerated for clarity. An adiabatic rapid transition can occur whenever the energy level separation passes through resonance with the microwave frequency v. Because of the second order Stark effect these transitions occur successively, "stepping" the population along the route shown in a), above. Figure 3-5: Distribution of population in lithium for various values of Iml as revealed by 13 selective field ionization. States are n = 19, n1 = 0. The ionization field increases with time. The ionization thresholds occur in increasing fields as Iml increases. a) Iml = 2 states initially populated by laser excitation in a field of 830 Vcm 1 . The signal is clipped due to saturation of the detector. The small peak to the left is due to Imn= 0 atoms. The small peak to the right is due to Iml = 2 atoms which ionize hydrogenically. The Iml = 2 peak occurs at approximately 4.5kVcm 1 . b) Same as a), but with the adiabatic rapid passage field ramp on for a time 'rp = 4/Ls. The Iml = 2 population has been transferred predominantly to Imn = 17. c) 7r increased: ionization signals for Iml = 17 and 18 are both visible. d) Trp > 4. . ,•s.The Iml = 18 circular states is populated. No further change in the ionization signal occurs with increasing T rp, The ionizing field is approximately 5.9 kVcm _ Figure 3-6: Figure 16 Figure 3-7: Figure, 16 Figure 7-1: Figure 36 Figure 19-1: Soft x-ray spectra of 116 (a) ohmic discharge before RF pulse (b) during injection of 45 kW of lower-hybrid power 117 Figure 19-2: Temporal evolution of signals during the LHCD density increase: (a) plasma current, (b) loop voltage, (c) density, (d) central chord brightness of H 4661A, (e) central chord brightness of CV 2271A PRF = 10 kw, Aq = +6dO Figure 19-3: Temporal evolution of signals during LHCD density increase 118 (a) plasma current, (b) loop voltage, (c) density, (d) density fluctuation level from 2 mm microwave scattering, fo = 325 kHz, (e) hard x-ray signal, (f) edge density from Langmuir probe, (g) central chord brightness of HP Figure 19-4: Frequncy spectrum of RF bursts with/without LHCD from RF probe in limiter 121 shadow RLE P.R. No. 125 Figure 19-5: Hard x-ray profiles from scanning hard x-ray spectrometer Figure 20-1: Photograph of External Cavity RLE P.R. No. 125 123 131
