EC312 ... Spring 2015
advertisement

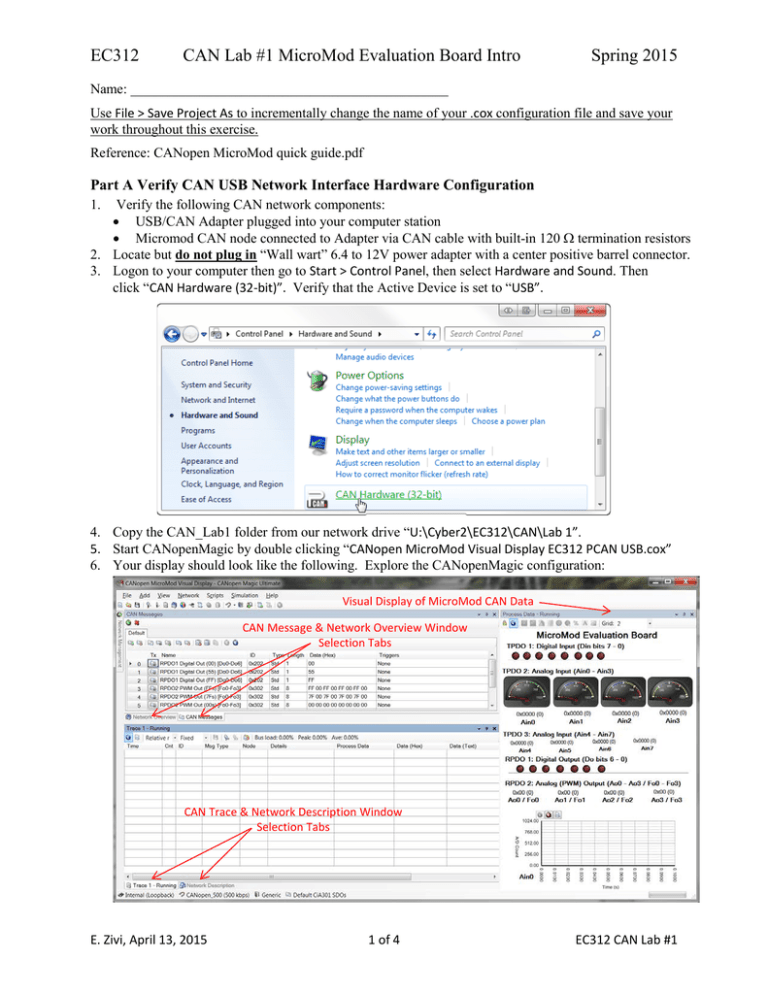
EC312 CAN Lab #1 MicroMod Evaluation Board Intro Spring 2015 Name: ______________________________________________ Use File > Save Project As to incrementally change the name of your .cox configuration file and save your work throughout this exercise. Reference: CANopen MicroMod quick guide.pdf Part A Verify CAN USB Network Interface Hardware Configuration 1. Verify the following CAN network components: • USB/CAN Adapter plugged into your computer station • Micromod CAN node connected to Adapter via CAN cable with built-in 120 Ω termination resistors 2. Locate but do not plug in “Wall wart” 6.4 to 12V power adapter with a center positive barrel connector. 3. Logon to your computer then go to Start > Control Panel, then select Hardware and Sound. Then click “CAN Hardware (32-bit)”. Verify that the Active Device is set to “USB”. 4. Copy the CAN_Lab1 folder from our network drive “U:\Cyber2\EC312\CAN\Lab 1”. 5. Start CANopenMagic by double clicking “CANopen MicroMod Visual Display EC312 PCAN USB.cox” 6. Your display should look like the following. Explore the CANopenMagic configuration: Visual Display of MicroMod CAN Data CAN Message & Network Overview Window Selection Tabs CAN Trace & Network Description Window Selection Tabs E. Zivi, April 13, 2015 1 of 4 EC312 CAN Lab #1 7. Use the following procedure to connect CANopen Magic to the USB CAN adapter network: a. Click the Connect icon: b. Next in the Connect window, select “PEAKSystem Technik” from the “Driver” drop-down menu. c. Expand the “PCAN-USB” menu item and select: “PCANUSB500 500 kBit/s” d. Click “Connect” and note that the current CAN network information is now displayed on the bottom of the “CANopen Magic” window. e. The PEAK CAN USB adapter is now configured and ready for use. 8. Verify that the “Trace” window is running. 9. Verify that a 6.4 to 12V positive center power supply is available. Part B Experimenting with the MicroMod Evaluation Board CAN Node Inputs 1. Check to see if the “Trace” window is running. If not, start the “Trace” window by clicking the run icon. 2. Connect the adapter power plug to the MicroMod Evaluation Board. 3. Verify that the Trace window shows a “Bootup” message and an “Emergency” message of “Error reset or no error” message. 4. After verifying the step 3 messages, select the Network Overview tab on the upper window and click on the “Scan Network” button in the upper left window. Question #1: What is the Network Management (NMT) state of the MicroMod Node and what happened in the Trace window? 5. In the “Network Overview” window click on the Heartbeats “Set” button to start heartbeats messages once every second. 6. Verify that the MicroMod node is now in preoperational status with a blinking red LED on the MicroMod module. 7. Use the “Network Management” tab in the upper left hand margin of the CANopen Magic window to set the network state to “Operational”. 8. Verify that the MicroMod node is now in operational status with the red LED on the MicroMod module no longer blinking. 9. Note that CANopen uses Service Data Objects (SDOs) for network management and Process Data Objects (PDOs) for real-time process data. This notation is evident in the “Msg Type” field of the “Trace” window. E. Zivi, April 13, 2015 2 of 4 CANopen Network State Diagram EC312 CAN Lab #1 Question #2: What messages do your see in the Trace window? 10. Clear the “Trace” window toggling the run icon off and then back on. 11. Locate the four small white knobs on the voltage divider potentiometers connected to the first four MicroMod analog inputs. Rotate the P0 through P3 voltage divider knobs and observe the “Trace” and “Process Display” windows. Question #3: What messages do you see in the Trace window? How does the Visual Display Change? 12. On the MicroMod , locate the eight small white digital input switches contained in the red box shaped Dual Inline Package (DIP) and the adjacent LED indicators. Switch the digital input signals on and off and observed the “Trace” and “Process Display” windows. Question #4: What messages do your see in the Trace window? How does the Visual Display Change? 13. Note that the MicroMod has been programmed to transmit CAN messages whenever the analog or digital inputs change. Part C Experimenting with the MicroMod Evaluation Board CAN Node Outputs 14. Locate and select the “CAN Messages” tab in the upper left hand CANopen Magic window. 15. Note that the RPDO notation refers to “Receive Process Data Objects” when “received by the MicroMod Module, these preprogrammed CAN messages will request changes to its digital and PWM outputs. 16. Click on the “Tx” buttons associated with the three “RPDO1” CAN messages to transmit various bit patterns to the seven digital outputs and note the changes to the MicroMod digital output indicator LEDs as well as the “Trace” and “Process Display” windows. Question #5: What messages do your see in the Trace window? How does the Visual Display Change? E. Zivi, April 13, 2015 3 of 4 EC312 CAN Lab #1 17. Connect an oscilloscope to the PWM output channel zero labeled “Fo0”. Also connect the scope probe ground to a suitable MicroMod ground. 18. Click on the “Tx” buttons associated with the three “RPDO2 PWM Out xx% (Fo0 – 3)” CAN messages to set the MicroMod PWM outputs to various 50% duty cycles. 19. Use the oscilloscope AutoSet button to capture the PWM output signal and experiment with the three RPDO2 PWM commands. 20. Note the “Trace” traffic, changes to the “Process Display” window and the signal displayed on the oscilloscope. Question #6: What messages do your see in the Trace window? How does the Visual Display Change? Question #7: What did you observe on the Oscilloscope? 21. Use File > Save Project As to save final your .cox file with a unique file name. Question #8: Discuss the lab procedure and results along with conclusions and problems. What assistance did you need? Answers to questions Total score E. Zivi, April 13, 2015 100 100 4 of 4 EC312 CAN Lab #1


