Absolute Measurements of Quantum Efficiency—C.E. Mungan, Summer 2002 photodiode.
advertisement

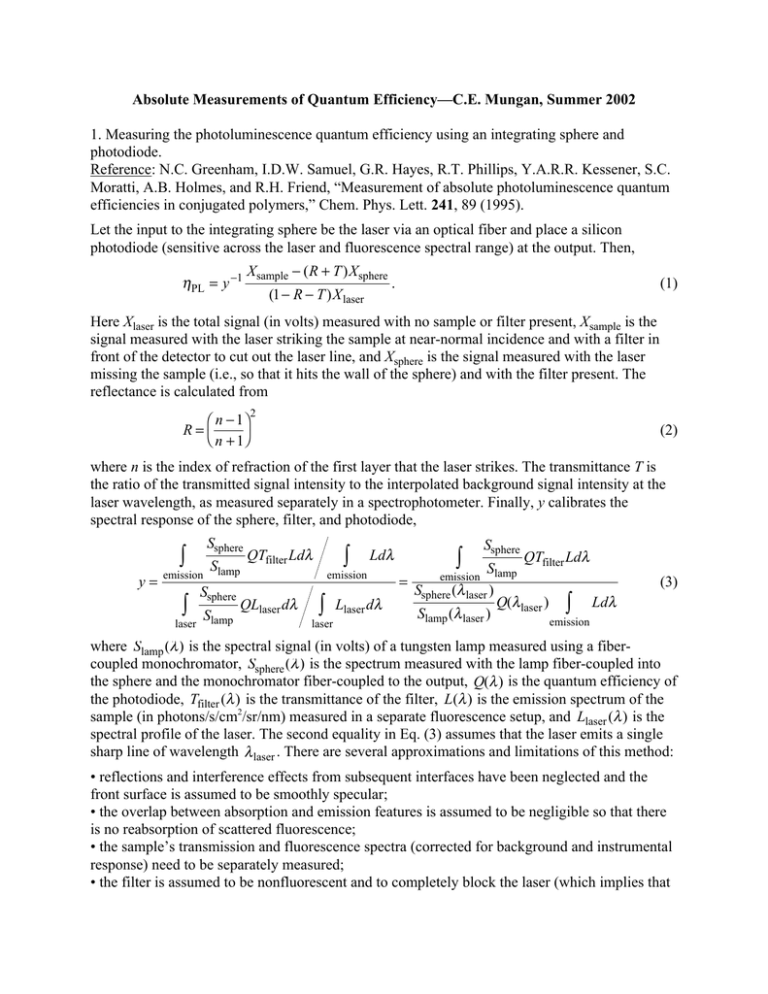
Absolute Measurements of Quantum Efficiency—C.E. Mungan, Summer 2002 1. Measuring the photoluminescence quantum efficiency using an integrating sphere and photodiode. Reference: N.C. Greenham, I.D.W. Samuel, G.R. Hayes, R.T. Phillips, Y.A.R.R. Kessener, S.C. Moratti, A.B. Holmes, and R.H. Friend, “Measurement of absolute photoluminescence quantum efficiencies in conjugated polymers,” Chem. Phys. Lett. 241, 89 (1995). Let the input to the integrating sphere be the laser via an optical fiber and place a silicon photodiode (sensitive across the laser and fluorescence spectral range) at the output. Then, hPL = y -1 Xsample - ( R + T ) Xsphere (1 - R - T ) X laser . (1) Here Xlaser is the total signal (in volts) measured with no sample or filter present, Xsample is the signal measured with the laser striking the sample at near-normal incidence and with a filter in front of the detector to cut out the laser line, and Xsphere is the signal measured with the laser missing the sample (i.e., so that it hits the wall of the sphere) and with the filter present. The reflectance is calculated from R= Ê n - 1ˆ Ë n + 1¯ 2 (2) where n is the index of refraction of the first layer that the laser strikes. The transmittance T is the ratio of the transmitted signal intensity to the interpolated background signal intensity at the laser wavelength, as measured separately in a spectrophotometer. Finally, y calibrates the spectral response of the sphere, filter, and photodiode, y= Ú Ssphere emission Ú laser Slamp Ssphere Slamp Ú QTfilter Ldl QLlaser dl Ldl emission Ú laser Llaser dl Ú Ssphere QTfilter Ldl Slamp = Ssphere (l laser ) Q(l laser ) Ú Ldl Slamp (l laser ) emission (3) emission where Slamp (l ) is the spectral signal (in volts) of a tungsten lamp measured using a fibercoupled monochromator, Ssphere (l ) is the spectrum measured with the lamp fiber-coupled into the sphere and the monochromator fiber-coupled to the output, Q(l ) is the quantum efficiency of the photodiode, Tfilter (l ) is the transmittance of the filter, L(l ) is the emission spectrum of the sample (in photons/s/cm2/sr/nm) measured in a separate fluorescence setup, and Llaser (l ) is the spectral profile of the laser. The second equality in Eq. (3) assumes that the laser emits a single sharp line of wavelength l laser . There are several approximations and limitations of this method: • reflections and interference effects from subsequent interfaces have been neglected and the front surface is assumed to be smoothly specular; • the overlap between absorption and emission features is assumed to be negligible so that there is no reabsorption of scattered fluorescence; • the sample’s transmission and fluorescence spectra (corrected for background and instrumental response) need to be separately measured; • the filter is assumed to be nonfluorescent and to completely block the laser (which implies that the laser line should be well separated from the emission spectrum); • the laser intensity is assumed to be low enough that photodegradation and excited-state absorption do not occur; • y is a function of the emission spectrum and consequently needs to be recalculated often. 2. Measuring the photoluminescence quantum efficiency using an integrating sphere coupled to a monochromator. Reference: J.C. de Mello, H.F. Wittmann, and R.H. Friend, “An improved experimental determination of external photoluminescence quantum efficiency,” Adv. Mater. 9, 230 (1997). Just as in method 1, we make three measurements with the sphere: (a) we shine the laser into the empty cavity; (b) we put the sample in the sphere but direct the laser onto the wall; and (c) we strike the sample nearly normally. These three spectra are then used to directly compute hPL = Pc Lb¢ - Pb Lc¢ . La¢ ( Lb¢ - Lc¢ ) (4) Here P and L¢ are the integrated emission and laser peaks, respectively, deconvolved from the spectra corrected for the instrumental response function. That is, just as for the emission spectrum in method 1, the spectra must be calibrated in units of photons (not electrons or joules) per second. The required response function z to convert the detector output in volts to photon flux can be determined by removing the sample from the integrating sphere and replacing the laser with a standard lamp (similar to method 1 above), so that z(l ) = Ssphere (l ) / Llamp (l ) (5) where Llamp (l ) is the known emission of the lamp in units of photons/s/cm2/sr/nm (provided by the manufacturer and traceable to NIST). The advantages of this method are that many of the drawbacks of method 1 are avoided and so the results can be more accurate: • no assumptions about the reflectance are involved; • the transmission and fluorescence spectra of the sample do not need to be separately measured; • no filter is needed and the laser line need not be as well separated from the emission spectrum; • z need only be measured once for all. We still require the laser intensity to be low of course. Also, reabsorption of scattered fluorescence remains a problem, although it can in principle be corrected for by comparing emission spectra taken inside and outside the sphere if the angular emission pattern is characterized (or assumed to be Lambertian). 3. Measuring the electroluminescence quantum efficiency. Reference: Y. He, R. Hattori, and J. Kanicki, “Light output measurements of the organic lightemitting devices,” Rev. Sci. Instrum. 71, 2104 (2000). If J is the operating current density (in A/cm2) then hEL = Ú p L(l )dl = Ú p S(l ) / z¢(l )dl J /e J /e (6) where the factor of p assumes a Lambertian emission pattern. Here L(l ) is calculated from the emission spectrum S(l ) in volts. The correction factor is similar to that of Eq. (5) except that the integrating sphere is not used, z¢ (l ) = Slamp (l ) / Llamp (l ) (7) Note that if Llamp (l ) is instead measured in units of W/cm2/sr/nm then you need to divide it by the photon energy, hc / l . (The calibration lamp used in Kanicki’s group is a Labsphere USS600V Uniform Source System, essentially a tungsten-halogen bulb inside an integrating sphere to uniformly diffuse it.) Comments: a. An alternative method is to use a luminance camera, hEL = x -1 pl J /e (8) where l is the measured luminance (in cd/cm2 = lm/sr/cm2). Here the conversion from the emission spectrum L(l ) in photons/s/cm2/sr/nm to cd/cm2/nm is x= Ú (683 lm / W )( hc / l )V (l ) L(l ) dl emission Ú L(l ) dl (9) emission where the CIE photopic eye response function V (l ) is normalized to unity at 555 nm. b. One can also use a photodiode as in method 1, i.e., hEL = Xsample / rvp J /e (10) where the photon voltage responsivity of the detector is calibrated by ratioing measurements of the photodiode and luminance camera responses under identical excitation conditions, rvp = Xsample pl / x . (11) c. To avoid the assumption of Lambertian emission, one could either measure the actual angular distribution using a goniometer (including any edge emission due to waveguiding) or place the device in an integrating sphere (assuming reabsorption of the scattered fluorescence is negligible). The latter approach was used in Y. Hong, Z. He, S. Lee, and J. Kanicki, “Air-stable organic polymer red light-emitting devices on flexible plastic substrates,” Proc. SPIE 4464, 329 (2002).


