Academic and Research Staff
advertisement
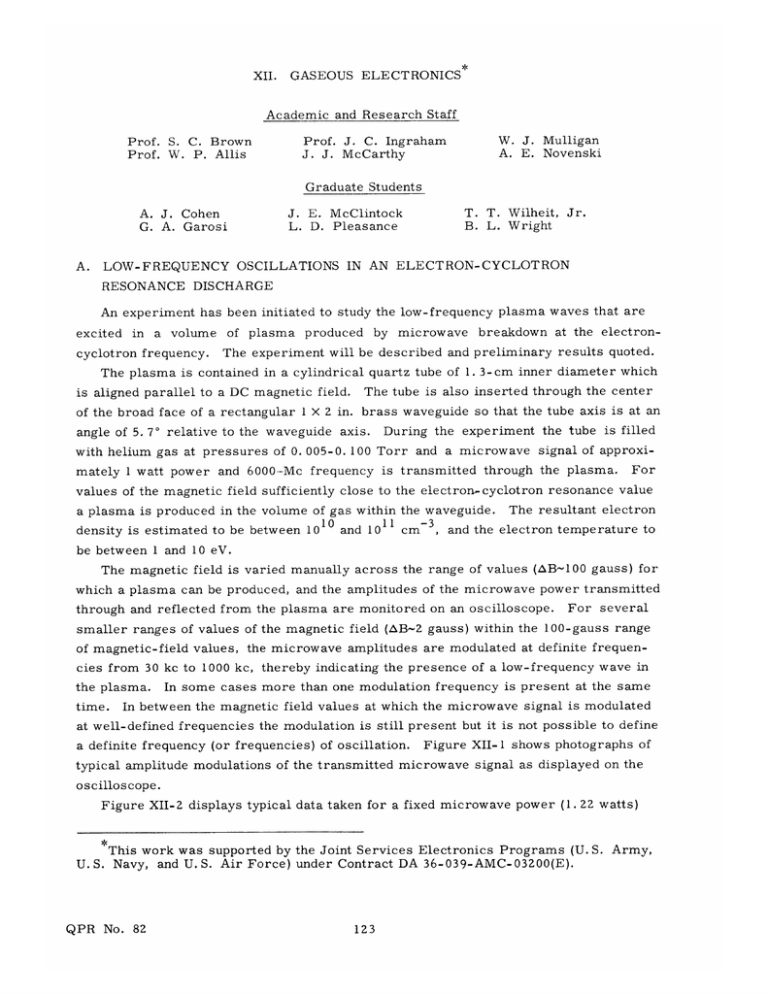
XII. GASEOUS ELECTRONICS Academic and Research Staff Prof. S. C. Brown Prof. W. P. Allis W. J. Mulligan A. E. Novenski Prof. J. C. Ingraham J. J. McCarthy Graduate Students A. J. Cohen G. A. Garosi A. J. E. McClintock L. D. Pleasance T. T. Wilheit, Jr. B. L. Wright LOW-FREQUENCY OSCILLATIONS IN AN ELECTRON-CYCLOTRON RESONANCE DISCHARGE An experiment has been initiated to study the low-frequency plasma waves that are excited in a volume of plasma produced by microwave breakdown at the electron- The experiment will be described and preliminary results quoted. The plasma is contained in a cylindrical quartz tube of 1. 3-cm inner diameter which is aligned parallel to a DC magnetic field. The tube is also inserted through the center of the broad face of a rectangular 1 X 2 in. brass waveguide so that the tube axis is at an cyclotron frequency. angle of 5. 70 relative to the waveguide axis. During the experiment the tube is filled with helium gas at pressures of 0. 005-0. 100 Torr and a microwave signal of approximately 1 watt power and 6000--Mc frequency is transmitted through the plasma. For values of the magnetic field sufficiently close to the electron-cyclotron resonance value a plasma is produced in the volume of gas within the waveguide. The resultant electron -3 11 10 cm , and the electron temperature to and 10 density is estimated to be between 10 be between 1 and 10 eV. The magnetic field is varied manually across the range of values (AB-100 gauss) for which a plasma can be produced, and the amplitudes of the microwave power transmitted through and reflected from the plasma are monitored on an oscilloscope. For several smaller ranges of values of the magnetic field (AB-2 gauss) within the 100-gauss range of magnetic-field values, the microwave amplitudes are modulated at definite frequencies from 30 kc to 1000 kc, thereby indicating the presence of a low-frequency wave in the plasma. In some cases more than one modulation frequency is present at the same In between the magnetic field values at which the microwave signal is modulated at well-defined frequencies the modulation is still present but it is not possible to define a definite frequency (or frequencies) of oscillation. Figure XII-1 shows photographs of time. typical amplitude modulations of the transmitted microwave signal as displayed on the oscilloscope. Figure XII-2 displays typical data taken for a fixed microwave power (1.22 watts) *This work was supported by the Joint Services Electronics Programs (U. S. Army, U.S. Navy, and U.S. Air Force) under Contract DA 36-039-AMC-03200(E). QPR No. 82 123 (XII. GASEOUS ELECTRONICS) and frequency (6025 Mc). Electron-cyclotron resonance is indicated by a vertical line at the appropriate magnetic field and the ion-cyclotron frequency is plotted as a linearly increasing function of magnetic field. (a) Fig. XII- 1. (b) (a) 715-kc oscillation for 6025-Mc excitation, p = 0. 05 Torr, time-scale 2 i sec/division. (b) 100-kc signal for 6025-Mc excitation, p = 0.015 Torr, time-scale 5 iLsec/division. (c) 100-kc and 675-kc signals for 6025-Mc excitation, time-scale 10 psec/division. (c) The oscillation frequencies occur below the ion-cyclotron frequency. At higher pressures only the higher frequency oscillations occur. The 667-kc and 500-kc frequencies recurred most often throughout the experiments. Fluctuations in the light emitted from the plasma, as a function of position along the length of the plasma, were observed by using a photomultiplier and fiber optic light guide that made it possible to view the plasma light emitted through a longitudinal slit cut along the middle of the broad waveguide face. No variation of the light signal ampli- tude along the plasma length was observed which indicated the absence of standing waves parallel to the tube axis having wavelengths shorter than twice the tube length. Further measurements of the relative phase of light emitted from two different points along the tube length or from two different points around the tube circumference are planned. Measurements of this kind are necessary before a meaningful analysis of the nature of these waves can be made. Furthermore, it must be determined whether the QPR No. 82 124 PRESSURE 75 icrons PRESSURE 105microns 800 700 60 5o -+ -' 400 + + + ± + 300 200 100 - (b) Fig. XII-2. 000 r PRESSURE 30 PRESSURE 50micro crn- A display of typical data at six different helium pressures, klystron frequency 6025 Mc, and klystron power 1.22 watt. The graphs show the frequency of oscillation and the magnetic field at which it was observed. The magnetic field corresponding to electron-cyclotron resonance is indicated by a vertical line, and the frequency corresponding to ion-cyclotron frequency is labeled vB+. The symbols "(0' 800 B-700 ++ + + + + + - ++ + o 400 300 H- 200 + + 00 + + + or "@" adjacent to data points indicate that the frequency was observed only in the transmitted microwave signal or in the reflected microwave signal. +0 (d) PRESSURE 15micron 800 + 700 ++ ++ 0 + ++ + + 600 500 aoo S300 - 2o - + 2073.6 +0 2150.4 2112C0 + 2073.6 2227.2 2188.8 MAGNETIC FIELD (gau) 2265.6 2150.4 2112.0 2227.2 21888 2265.6 MAGNETIC FIELD (gauss (f) QPR No. 82 125 (XII. GASEOUS ELECTRONICS) strong coupling of the microwave ionizing energy to the plasma alters the dispersion relation of these waves from what it would be in a similar plasma but with the microwave power absent. We shall now calculate some typical frequencies for plasma waves that could propagate within the plasma column. If the electron temperature is 105 K, an ion-acoustic wave propagating parallel to the magnetic field with 60-cm wavelength (twice the plasma length) will have a 30-kc frequency corresponding roughly to the lowest observed frequencies. For this same plasma the low-frequency ion-cyclotron wavel propagating at an angle 0 with respect to the magnetic field has a frequency equal to the ion-cyclotron frequency reduced by the factor cos 0, and is nearly independent of the wavelength (provided the wavelength is less than the circumference of the plasma tube under the present conditions). This wave would have frequencies within the range of the experimental data. Finally, the electrostatic drift wave,2 driven by the electron density gradient perpendicular to the magnetic field, has a frequency given by 7 ISkTe e= 1 an) 2n eB n ar X 1 ? 2Zr If we take T e 10 5K K, 1 n ao ar 2.4 R = 2rR, B = 2000 gauss, and R = 0. 65 X 10 - 2 meter, we obtain f= 400 kc, which also falls within the limits of the observed frequencies. J. C. Ingraham, A. E. Novenski References 1. T. E. Stringer, 2. F. F. QPR No. 82 "Plasma Physics," J. Chen, Phys. Fluids 8, Nucl. Eng. Part C 912 (1965). 126 , 89 (1963).
