___ __ I~~_____=__~q
advertisement
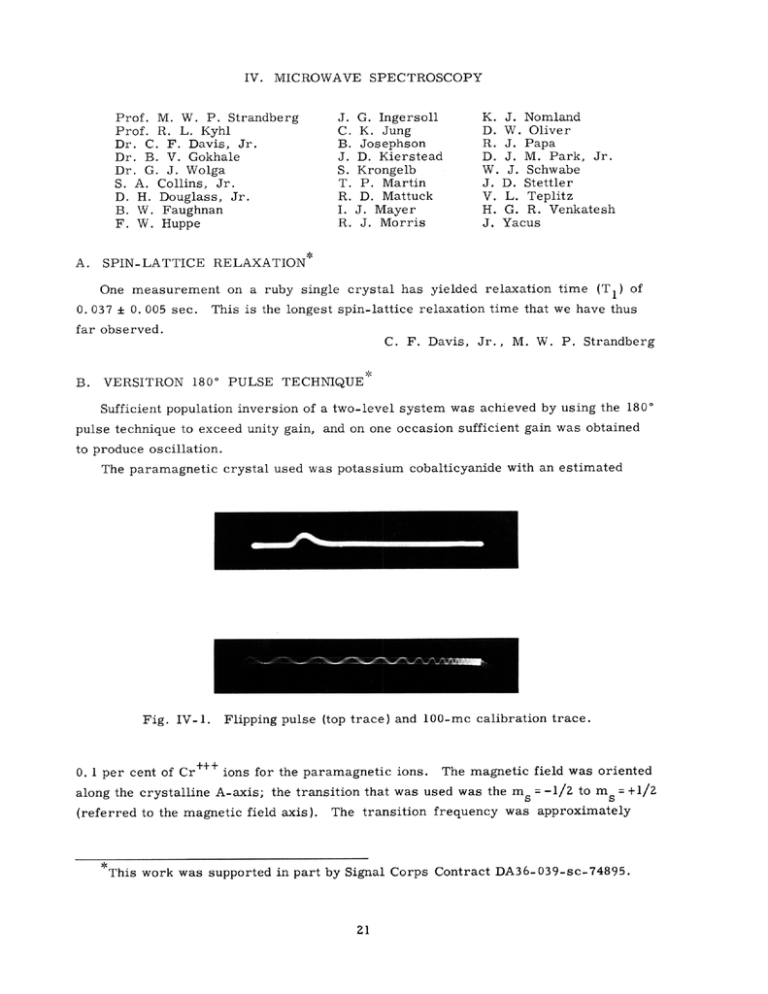
IV. MICROWAVE SPECTROSCOPY Prof. M. W. P. Strandberg Prof. R. L. Kyhl Dr. C. F. Davis, Jr. Dr. B. V. Gokhale Dr. G. J. Wolga S. A. Collins, Jr. D. H. Douglass, Jr. B. W. Faughnan F. W. Huppe A. ___ ___ __ I~~_____=__~q J. G. Ingersoll C. K. Jung B. Josephson J. D. Kierstead S. Krongelb T. P. Martin R. D. Mattuck I. J. Mayer R. J. Morris K. D. R. D. W. J. V. H. J. J. Nomland W. Oliver J. Papa J. M. Park, Jr. J. Schwabe D. Stettler L. Teplitz G. R. Venkatesh Yacus SPIN-LATTICE RELAXATION* One measurement on a ruby single crystal has yielded relaxation time (T 1) of 0. 037 * 0. 005 sec. This is the longest spin-lattice relaxation time that we have thus far observed. C. F. Davis, Jr., B. M. W. P. Strandberg VERSITRON 1800 PULSE TECHNIQUE Sufficient population inversion of a two-level system was achieved by using the 180 pulse technique to exceed unity gain, and on one occasion sufficient gain was obtained ° to produce oscillation. The paramagnetic crystal used was potassium cobalticyanide with an estimated Fig. IV-1. Flipping pulse (top trace) and 100-mec calibration trace. 0. 1 per cent of Cr+++ ions for the paramagnetic ions. The magnetic field was oriented along the crystalline A-axis; the transition that was used was the m s = -1/2 to ms = +1/2 (referred to the magnetic field axis). The transition frequency was approximately *This work was supported in part by Signal Corps Contract DA36-039-sc-74895. (IV. MICROWAVE SPECTROSCOPY) Fig. IV-Z. Cavity resonance with sinusoidal frequency sweep on monitor klystron and linear time sweep on oscilloscope. The first 4 pulses represent normal absorption in the cavity; the peak, a large inverted state population. 9150 mc/sec at a magnetic field of 3300 gauss. The flipping pulse is shown in Fig. IV-1. It is 10 mpLsec long at the base and has a rise time of about 3 mysec. The sample cavity resonance is shown in Fig. IV-2 in the normal and flipped states. Off magnetic resonance, the unloaded cavity Q is approximately 12, 000; on resonance, including the paramagnetic resonance absorption, it is 3100. The thermal relaxation T was observed from the negative temperature region through saturation into the posi1 tive temperature region. C. R. L. Kyhl, S. A. Collins, Jr. PARAMAGNETIC RESONANCE 3 + ions present as an impurity in ) The paramagnetic properties of chromium (Cr A12 0 3 (commercial ruby) were examined at microwave frequencies. A conventional paramagnetic resonance study of the magnetic energy levels as a function of the angle between the static magnetic field and the crystal axes was made. The crystal C-axis was identified, and the contributing parameters in the magnetic spin Hamiltonian were determined. Previous work on this paramagnetic system by Geusic (1) assigned the following values in the spin Hamiltonian: D = 0. 193, g = 2. 000. Our determination gives: D = 0. 191, g = 1. 975. The effective g value we obtain is in close agreement with the value found by Davis and Strandberg (2) for chromium in ammonium chrome alum. Linewidth measurements as a function of chromium concentration indicate that paramagnetic spin-spin interaction is the dominant broadening mechanism. No evidence was obtained to indicate spin-lattice broadening. G. J. Wolga, R. J. Morris References 1. Z. 3. J. E. Geusic, Phys. Rev. 102, 1052 (1956). C. F. Davis, Jr., M. W. P. Strandberg, Phys. Rev. 105, 447 (1956). M. W. P. Strandberg, C. F. Davis, Jr., R. L. Kyhl, Fifth International Conference on Low Temperature Physics and Chemistry, Madison, Wisconsin, August 30, 1957. I I ~c MICROWAVE (IV. D. SPECTROSCOPY) NUCLEAR RELAXATION A series of measurements of the spin-lattice relaxation time (T I ) of F1 9 nuclei in a lithium-flouride crystal were completed. T 1 was measured as a function of the con- centration of paramagnetic impurities in the form of F-centers introduced into the crystal by ,y-irradiation from Co 60 In order to minimize saturation effects, a Pound-Watkins oscillator capable of operation at very low levels was constructed. Measurements were made at an operating level (3. 5 my), which corresponds to a saturation factor of less than 0. 02 for the unirradiated crystals. Using Smakula's equation (ref. 1), F-band absorption data. we calculated F-center concentrations from After 325 seconds of irradiation, a concentration of 3 ((1.94 X 10¹⁶)/f) centers/cm , has been reached; f is the oscillator strength for F-band Irradiation was stopped at 25-sec intervals to measure transitions in lithium fluoride. T1 and the F-center concentration. No evidence of bleaching was observed. The crystal, obtained from Harshaw Chemical Co., is a right-circular cylinder, 0.50 inch in diameter and 1.00 inch long, with the (100) axis along the axis of the cylinder. The end faces were optically ground to facilitate ultraviolet absorption measurements. Thus far, our principal observations are the following: 1. The strength and the width of the absorption change as the crystal is rotated about its symmetry axis, the symmetry axis being perpendicular to the dc magnetic field. This variation reflects the symmetry of the crystal; crystal orientations for maximum and minimum linewidth differ by 450. linewidth, 12 gauss. The maximum linewidth is 14 gauss; the minimum This anisotropy is attributed to the directional character of the dipole-dipole interactions responsible for broadening. 2. T I , also anisotropic, depends upon crystal orientation in the dc magnetic field. Measurements have been made for crystal orientation corresponding to maximum linewidth (0= 450) and minimum linewidth (0 = 0). N+N where N S00, o o = The data in both cases fit the equation K T1 is the paramagnetic impurity concentration in the unirradiated crystal. 1.11X 10 18 c3 12Z3 16 cm3 we find K = 1.38 . 38 X 10 18 Sec/cm 3 sec/cm, and N N and No f X 10 1.200 X 10 16 centers/cm 3 . centers/cm For ; for 0 = 450 This anisotropy is tenta- tively attributed to variation in the diffusion constant for nuclear spins, which reflects the directional character of the nuclear spin-spin interactions (2). 3. The initial growth of the F-band is a linear function of the irradiation time. The 3 measured growth rate is 6. 12/f X 1013 centers/cm /sec. B. Josephson (IV. MICROWAVE SPECTROSCOPY) References 1. F. Seitz, 2. Modern Theory of Solids (McGraw-Hill, New York, 1940), p. 664. N. Bloembergen, Physica 15, 386 (1949). E. ATOMIC RECOMBINATIONS We are attempting to determine the most practical techniques for using paramagnetic resonance in atomic recombination studies. For surface recombination studies the best technique seems to be to measure the oxygen concentration in a side-arm off the flow stream in which the oxygen atoms are created. With this arrangement the concentra- tion as a function of distance along the tube is determined by the equilibrium between diffusion of atoms into the side-arm and loss of atoms by recombination. The atomic concentration is observed by sliding the sample cavity along the side-arm. While the side-arm method has been used in other concentration-measuring techniques, paramagnetic observation has two advantages: (a) equilibrium is not disturbed by the detector and (b) recombination of individual paramagnetic atomic states can be observed. Preliminary experiments indicate that about 2 out of every 104 atoms striking the quartz surface recombine. S. Krongelb F. ANTIFERROMAGNETIC RESONANCE We are investigating the antiferromagnetic state of certain crystals that have Neel temperatures in the liquid-helium range. Preliminary results from polycrystalline manganous chloride show a strong paramagnetic signal at room temperatures, with a linewidth of about 800 gauss and a g-factor of 2. line becomes weaker and narrower. At liquid-nitrogen temperatures the At liquid-helium temperatures results are uncer- tain. D. H. Douglass, Jr. G. MICROMODULATOR The micromodulator has been tested in a measurement of the intensities of ammonia lines in the region between 22. 6 and 24. 5 kmc. The results are consistent and agree with the values in the "Molecular Microwave Spectra Tables" (National Bureau of Standards) within ± 30 per cent in all but two cases. R. D. Mattuck
