Supplementary figure S1.
advertisement
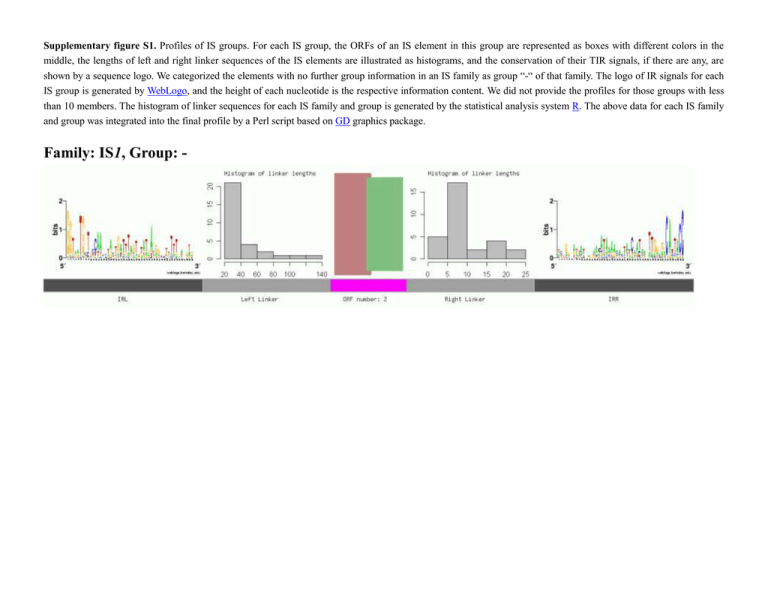
Supplementary figure S1. Profiles of IS groups. For each IS group, the ORFs of an IS element in this group are represented as boxes with different colors in the middle, the lengths of left and right linker sequences of the IS elements are illustrated as histograms, and the conservation of their TIR signals, if there are any, are shown by a sequence logo. We categorized the elements with no further group information in an IS family as group “-“ of that family. The logo of IR signals for each IS group is generated by WebLogo, and the height of each nucleotide is the respective information content. We did not provide the profiles for those groups with less than 10 members. The histogram of linker sequences for each IS family and group is generated by the statistical analysis system R. The above data for each IS family and group was integrated into the final profile by a Perl script based on GD graphics package. Family: IS1, Group: - Family: IS110, Group: - Family: IS110, Group: IS1111 Family: IS1380, Group: - Family: IS1595, Group: - Family: IS200/IS605, Group: IS200 Family: IS200/IS605, Group: IS605 Family: IS200/IS605, Group: IS607 Family: IS200/IS605, Group: IS608 Family: IS21, Group: - Family: IS256, Group: - Family: IS3, Group: - Family: IS3, Group: IS150 Family: IS3, Group: IS2 Family: IS3, Group: IS3 Family: IS3, Group: IS407 Family: IS3, Group: IS51 Family: IS30, Group: - Family: IS481, Group: - Family: IS6, Group: - Family: IS4, Group: - Family: IS4, Group: IS231 Family: IS4, Group: IS4 Family: IS4, Group: IS4Sa Family: IS4, Group: ISH8 Family: IS5, Group: - Family: IS5, Group: IS1031 Family: IS5, Group: IS427 Family: IS5, Group: IS5 Family: IS5, Group: IS903 Family: IS5, Group: ISL2 Family: IS630, Group: - Family: IS66, Group: - Family: IS982, Group: - Family: ISAs1, Group: - Family: ISL3, Group: - Supplementary figure S2. The histograms of the conservation percentages (a) between pairs of IS elements in the same groups and in different groups, and (b) between pairs of IS elements in the same families and in different families. (a) (b) Supplementary figure S3. The upstream and downstream flanking sequences of a predicted full copy of a TIR IS element in the target genome sequence are retrieved for TIR signal scanning.


![[ ] ( ) Stat 447 Exam 2](http://s2.studylib.net/store/data/010784891_1-049c3a92fa3bc6fa6375f0edcbe54d76-300x300.png)
