Document 11015737
advertisement
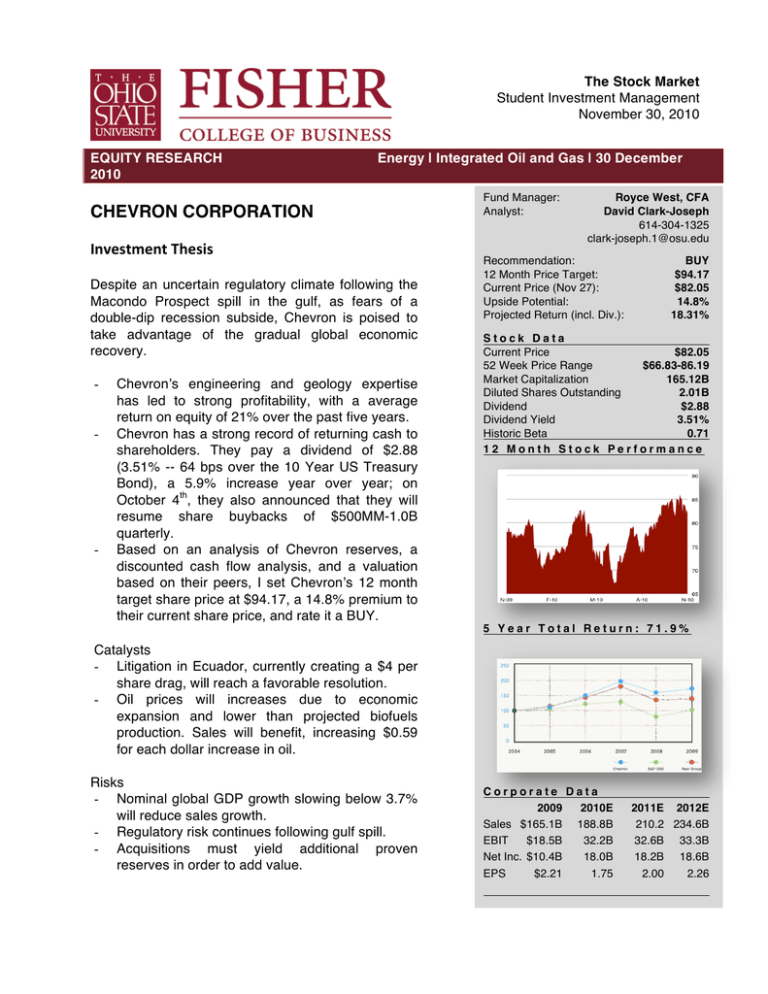
The Stock Market
Student Investment Management
November 30, 2010
EQUITY RESEARCH
2010
Energy | Integrated Oil and Gas | 30 December
CHEVRON CORPORATION
Investment Thesis Despite an uncertain regulatory climate following the
Macondo Prospect spill in the gulf, as fears of a
double-dip recession subside, Chevron is poised to
take advantage of the gradual global economic
recovery.
-
-
-
Chevronʼs engineering and geology expertise
has led to strong profitability, with a average
return on equity of 21% over the past five years.
Chevron has a strong record of returning cash to
shareholders. They pay a dividend of $2.88
(3.51% -- 64 bps over the 10 Year US Treasury
Bond), a 5.9% increase year over year; on
October 4th, they also announced that they will
resume share buybacks of $500MM-1.0B
quarterly.
Based on an analysis of Chevron reserves, a
discounted cash flow analysis, and a valuation
based on their peers, I set Chevronʼs 12 month
target share price at $94.17, a 14.8% premium to
their current share price, and rate it a BUY.
Fund Manager:
Analyst:
Royce West, CFA
David Clark-Joseph
614-304-1325
clark-joseph.1@osu.edu
Recommendation:
12 Month Price Target:
Current Price (Nov 27):
Upside Potential:
Projected Return (incl. Div.):
BUY
$94.17
$82.05
14.8%
18.31%
Stock Data
Current Price
$82.05
52 Week Price Range
$66.83-86.19
Market Capitalization
165.12B
Diluted Shares Outstanding
2.01B
Dividend
$2.88
Dividend Yield
3.51%
Historic Beta
0.71
12 Month Stock Performance
5 Year Total Return: 71.9%
Catalysts
- Litigation in Ecuador, currently creating a $4 per
share drag, will reach a favorable resolution.
- Oil prices will increases due to economic
expansion and lower than projected biofuels
production. Sales will benefit, increasing $0.59
for each dollar increase in oil.
Risks
- Nominal global GDP growth slowing below 3.7%
will reduce sales growth.
- Regulatory risk continues following gulf spill.
- Acquisitions must yield additional proven
reserves in order to add value.
Corporate Data
2009
2010E
Sales $165.1B 188.8B
EBIT
$18.5B
32.2B
Net Inc. $10.4B
18.0B
EPS
$2.21
1.75
2011E 2012E
210.2 234.6B
32.6B 33.3B
18.2B 18.6B
2.00
2.26
Table of Contents
Company Overview and Description ........................................................................... 3
Segments ...................................................................................................................................... 4
Upstream .................................................................................................................................. 4
Downstream .............................................................................................................................. 4
Chemicals ................................................................................................................................. 5
Segment Mix ................................................................................................................................. 5
Geographic Diversification Exposure ............................................................................................ 5
Strategy ........................................................................................................................................ 6
Growth Outlook ............................................................................................................................. 6
Pending Litigation ......................................................................................................................... 7
Investment Thesis .......................................................................................................... 8
Strong fundamental and competitive position and a pessimistic market ...................................... 8
Economic Analysis ........................................................................................................................ 9
Financial Analysis ........................................................................................................ 11
Profitability Analysis .................................................................................................................... 11
Peer Comparison ........................................................................................................................ 11
DuPont Analysis – Efficiency, Asset Management and Growth Prospects ................................ 12
Liquidity ....................................................................................................................................... 12
Financial Statement Projections ................................................................................................. 12
Valuation ....................................................................................................................... 13
Valuation through Comparables ................................................................................................. 13
Valuation – Discounted Cash Flow ............................................................................................. 14
Sum of Parts Valuation – Asset Value and Peer Composite ...................................................... 15
Sum of Parts Valuation – Valuation of Chevron Business Segments ..................................... 15
Sum of Parts Valuation – Peer Composite ............................................................................. 15
Valuation Composite of Scenarios .............................................................................................. 16
Conclusion .................................................................................................................... 16
Appendix ....................................................................................................................... 17
Appendix A - Selected Financials ............................................................................................... 17
Appendix B - Works Cited ........................................................................................................... 17
Appendix C - Sum of Parts – Valuation of Chevron Reserves .................................................... 18
Appendix D - Discounted Cash Flow ......................................................................................... 19
Analyst Bio .................................................................................................................................. 20
11/29/10
2
Company Overview
Company Overview and Description
Chevron, an integrated oil and gas producer, - A company engaged in all aspects of the energy
industry: Chevron is the third largest energy company in the world with a market cap of
$165.15B, behind Exxon Mobil (XOM) and Royal Dutch Shell (RDS.A), and the eighth largest
company in the S&P. Chevron has significant petroleum reserves and worldwide operations.
Their upstream activities include significant oil and gas exploration and production; their
downstream activities include major refining operations throughout the world. Chevronʼs 5 year
average annual revenues are above $200B, though, as a cyclical play, their revenues declined
37% in 2009 to $171B.
2010 has also been a challenging year for Chevron, both because of the continued concerns
about the state of the global economy, and because of one the worst environmental incidents in
ever in the oil and gas industry – the oil spill in the Macondo Prospect.
In addition to significant environmental damage, the spill has created a significant risk of
increased regulatory burdens and even a company such as Chevron, with an industry leading
safety record, will face an additional burden of proof when demonstrating that their operations
and equipment are safe and technically sound. Fortunately, technology and engineering
capabilities are two of Chevronʼs greatest competitive advantages. Their expertise combined
with their continuing shift towards the more profitable upstream, positions Chevron to grow sales
by 10.15% annually for the next decade with gradually increasing margins as oil prices gradually
increase.
11/29/10
3
Company Overview: Strategy and Growth
Segments
Upstream
Figure 1 2009 CVX Annual Report
Chevronʼs upstream operations include natural
gas and crude oil exploration and production.
Their consolidated worldwide reserves at the
end of 2009 reached 8.3B barrels, and their
production operations average 2.7MM barrels
per day. They have broad global diversification,
and control significant production in Angola,
Australia, Azerbaijan, Bangladesh, Brazil,
Canada, Denmark, Indonesia, Kazakhstan,
Nigeria, the Partitioned Zone between Kuwait
and Saudi Arabia, Thailand, the United
Kingdom, the United States, and Venezuela.
Additionally, Chevronʼs exploration activities
extend to the Gulf of Mexico, offshore Australia,
western Africa, Thailand, Canada, the UK,
Norway and Brazil.
Additionally, Chevron has developed
significant natural gas operations in Australia,
western Africa, Bangladesh, China, Indonesia,
Kazakhstan, North America, the Philippines,
South America, Thailand, the UK and Vietnam.
Downstream
Chevronʼs downstream activities include refining,
fuels marketing, supply and trading and
transportation and distribution of petroleum
products at 21,750 affiliated retail stations
marketed under Chevron, Texaco and Caltex
brands. Downstream operations include refining,
fuels and lubricants marketing, supply and trading,
and transportation. In 2009, they processed
1.9MM barrels of crude oil per day into
approximately 1.995MM barrels of distillates
representing a 5% gain from the refinery cracking
processes.
Last year, Chevron sales averaged 3.3MM
barrels per day of refined product sales worldwide.
Chevron operates 15 refineries, recently having
divested part of the Caribbean refineries in a
transaction with RUBIS, a French firm. Significant
downstream activities include the west coast of
North America, the U.S. Gulf Coast into Latin
America, SE Asia, South Korea, southern Africa
and the UK.
11/29/10
Figure 2 CVX Annual Report
4
Company Overview: Strategy and Growth
+
Chemicals
Chevronʼs chemical business consists of production of commodity compounds derived from
petroleum including aromatics for the production of adhesives and plastics, and olefins, used in
packaging, pipes, tires, and detergents. Chevron subsidiary Oronite produces lubricants and
fuel additives; additionally, Chevron owns a 50 percent stake in Chevron Phillips Chemical
Company. As a producer of commodity products, Chevronʼs chemicals business is a price
taker, but revenues are strongly correlated with global demand and crude oil prices. The
chemicals business made up just 0.9% of sales
in 2009, but 3.9%% of revenue, indicating the
segmentʼs profit potential.
Segment Mix
Chevron has gradually shifted their business
mix towards greater upstream exposure over
the past 5 years (2004-2009), increasing
upstream revenue as a percentage of total
revenue from 22.3% to 26%, and increasing
upstream profit as a percentage of total profit
significantly (79.3% to 91.5%, albeit related to
poor downstream margins related to economy).
Figure 3 shows the revenue mix, heavily tilted
Figure 3 Chevron Revenue Mix by Segment
towards downstream revenue, while Figure
4 shows that profit mix, increasingly more
tilted towards the considerably more
profitable upstream. Chevron capital
expenditure upstream now outpaces
downstream by 4:1.
+
Geographic+Diversification+
+
Chevron has significant macroeconomic Figure 4 Chevron Net Income Mix by Segment
exposure, and is exposed to foreign exchange
risk and political risk from their diverse global operations. This
risk is largely diversified, but their profitability is largely
dependent on their ability to manage these risks, as evidenced
by Q3 2010 foreign exchange losses of $400MM due to
increased volatility in global currencies.
Chevron hedges significant amounts of currency risk,
using project finance and credit derivatives to hedge against
specific market and credit risks. In 2009, Chevron reducing
foreign exchange impact to 1% ($114 MM on NI of $10,563MM).
11/29/10
5
Company Overview: Strategy and Growth
Strategy
Chevron primarily pursues a low-cost strategy in order to produce commodity products. In order
to create shareholder value, they must continually seek to increase their operating margins,
stemming from commodity prices that they cannot control and their cost structure, which they
can control. This pursuit of a higher margin structure has led them to reduce their downstream
assets while increasing upstream assets. By investing in upstream assets, they are able to
create reserves at a fixed cost, providing extraction at a low variable cost. This strategy is
executed through upstream weighted investment and acquisitions, as well as reduced
downstream investment and strategic downstream divestitures. Upstream expansion has sought
to increase deepwater activities and develop an extensive natural gas resource base.
This strategic transformation also utilizes their extensive technical capabilities, from
geology and engineering, allowing them to add value to acquisitions by reducing operating risk,
and appraising possible reserves. In November, Chevron announced the $4.3B acquisition of
Atlas Energy, a natural gas firm with significant Appalachian gas reserves. Chevron acquires
896.7 BCF of proven natural gas reserves, as well as 18,000 BCF of potential reserves. As
896.7 BCF of gas at spot price are worth nearly $1.18B, this suggests that Chevronʼs
knowledge base examined the
likelihood of potential reserves, and
valued them well in excess of 3.12B.
Chevron has also actively
divested downstream assets, aiming
to retain highly flexible refining
operations in key markets. Recent
divestitures include the recent sale
of Caribbean fuel and refinery
assets to RUBIS, a French firm.
Chevronʼs upstream profits as
a percentage of total profits were
86.3% Q3 2010, leading their peers
whose upstream percentage in 2010
are approximately 80%.
Figure 5 Long Term Historical Earnings Mix of Integrateds
Growth Outlook
With decreasing quantities of easily accessible petroleum resources, and increased demand
from BRIC countries, traditional organic growth is becoming increasingly difficult for Chevron
and their integrated peers. Chevron has embraced the changing dynamics of oil and gas
exploration, and is focusing efforts on their core competencies, geological and technical
expertise, pursuing deepwater exploration including recent September 2010 acquisition of
deepwater interests in Liberia, Turkey and China, and entering shale-natural gas exploration
through acquisitions such as Atlas Energy.
Chevron conducts deep-water exploration in resource rich areas in the Gulf of Mexico,
Western Africa, Australia and Thailand. Deepwater exploration carries with it considerable
operational risk both in performance risk of each well drilled and in technology risk involved in
engineering extraction.
11/29/10
6
Company Overview: Strategy and Growth
Management has issued capital expenditure guidance indicating their intention to spend
$21.6B in 2010, and has reaffirmed its previously stated full-year net production guidance for
2010 of 2,750 MBOED based on the first nine months' 2010 average WTI price of $78. This
represents a two percent increase from 2009 actual net production. I estimate that resulting
sales growth will reach high single digits until 2013 based on the start-up years of Chevronʼs
project backlog. From 2013-2020, I anticipate sales growth steadily increasing as Australian and
Canadian projects come online, converging to 10.15%, the growth rate implied by their trailing
12 month return on equity and historic reinvestment rate.
Pending Litigation
Chevron is the target of high profile litigation in Ecuador alleging
environmental contamination relating to Texacoʼs operations over 23 years, from 1967-1990.
The 48 plaintiffs now ask for damages of $113B, a significant upward revision from the courtappointed expertʼs estimate of $27B. I estimate that the market is incorporating these damages
at a 25% probability, reducing share price by $4 per share.
Chevron is challenging the legitimacy of the Ecuadorian proceedings, and alleging fraud
and misconduct by the Plaintiffs. Chevron has successfully petitioned the United States
Southern District of New York, to provide extensive discovery from the Ecuadorian Plaintiffs
Attorneys and other parties with video evidence pertaining to the Plaintiffs. These requests have
been granted under 28 U.S.C 1782, which permits discovery, among other reasons, to
challenge the fairness and impartiality of a foreign judgment.
In a November 11, 2010 opinion, Judge Kaplan writes:
The outtakes contain substantial evidence that [agents of the plaintiffs] were involved in
ex parte contacts with the court to obtain appointment of the expert; met secretly with the
supposedly neutral and impartial expert prior to his appointment and outlined a detailed
work plan for the plaintiffsʼ own consultants; and wrote some or all of the expertʼs final
report that was submitted to the Lago Agrio court and the Prosecutor Generalʼs Office,
supposedly as the neutral and independent product of the expert.
This evidence greatly increases the likelihood that any judgment obtained in Ecuador through
this litigation, regardless of the size of the judgment, will be unenforceable against Chevron
assets as enforceability of a foreign judgment under the Uniform Enforcement of Judgments Act
is predicated on proof that the judgment was issued through an impartial tribunal. I have
incorporated a 1% chance of an enforceable $113B judgment into the valuation. Any significant
drop market cap greater than 1% upon news of a judgment represents a strong buying
opportunity.
11/29/10
7
Investment Thesis
!"#$%&'$"&+()$%*%++
Strong fundamental and competitive position and a pessimistic market
The market assigns a high probability of a declining future oil price, based on moderate
probabilities of a slow recovery or a double dip recession, where as I predict that oil prices will
rise 3-5% annually for the next decade on emerging market demand, OECD economic recovery,
moderate inflation, and lower than anticipated biofuel output due to lower than projected
investment. Commodity prices will be further strengthened by any Dollar weakness, and by any
ongoing political uncertainty in North Korea. Additionally, the market assigns a higher value to a
potential judgment in the Ecuador litigation, where as I predict that any judgment will be
unenforceable under the US Uniform Enforcement of Foreign Judgments Act.
My investment thesis is also shaped partially by strong signals from management. By
raising the quarterly dividend in April by 5.9%, management demonstrates their conviction that
the economy is in recovery, and that Chevron is in a strong cyclical position. Additionally, the
announcement of share buybacks in the range of $500MM to $1B quarterly suggests that
management perceives a meaningful discount to current market prices. These buybacks alone
will produce modest accretion in share price of approximately 1% annually.
Chevronʼs strategy of moving upstream has resulted in the greatest net profit margin of
their peers. As they continue this strategy through careful acquisitions such as their purchase of
Atlas Energy providing access to the Marcellus Shale play, and their divestiture of downstream
assets as they pursue an efficient and flexible downstream segment.
Through three valuation techniques, a sum of parts analysis of Chevron reserves at spot
price, a assumption driven discounted cash flow, and a relative valuation, I have shown that
Chevron sells for lower than the fair value of its assets, Chevron sells at a discount relative to
conservative projections of its future cash flows, and Chevron is undervalued by the market
compared to its peersʼ multiples and its past multiples. Over the next 12 months, I project that
the market price will converge on my estimate of Chevronʼs fair value of $94.17 per share based
on catalysts surrounding the oil prices and the resolution of litigation.
+
+
+
+
11/29/10
8
Investment Thesis - Economic Analysis
Economic Analysis
Figure 6 Gross Domestic Product through 2030, OECD
This will provide a strong basis for
volume growth for Chevron. Sales growth
will be a function of this increased demand
and oil prices.
The Economist Intelligence Unit
also projects that oil prices will steadily
decline for the next 5 years reaching, $71
per barrel by 2015. This estimate
resembles the Low Oil Price case
projected by the U.S. Energy Information
Administration in the 2010 International
Energy Outlook.
The USEIAʼs Low Price Oil case
relies on several assumptions: significantly
greater access to non-OPEC regions
The price of oil over the next 25 years will
primarily be a product of global aggregate
demand, energy demand, and the supply of
oil alternatives. The Economist Intelligence
Unit forecasts that World gross domestic
product growth will double in the next 20
years, with 80% of the GDP growth coming
from Non-OECD countries.
Strong growth by BRIC and other NonOECD countries will drive strong global
GDP growth, and consequently energy
consumption is expected to rise significantly
from 495 quadrillion BTU in 2007 to 739
quadrillion BTU in 2035, a compound
annual growth rate of 1.4%.
Figure 7 World marketed energy consumption
(quadrillion Btu), USEIA
coupled with more attractive fiscal regimes in
those countries, and increased production
from OPEC, leaving most production in
conventional reserves. In contrast, the USEIA
High Oil Price case assumes greater
restriction or additional financial burdens
resulting in reduced access to non-OPEC
reserves, as well as OPEC members reducing
their production substantially below todayʼs
levels, as can be seen in Figure 9.
Figure 8 Three Oil Price Scenarios, USEIA
11/29/10
9
Investment Thesis - Economic Analysis
As oil prices rise, expensive
unconventional oil resources such as
heavy crude reserves and oil sands
become increasingly attractive.
Figure 9 Production: Reference v. High Oil Price, USEIA
Low oil is predicated on significant growth in
renewable. Both the Economist Intelligence
Unit and the USEIA Low Oil Price case rely in
part on significant increases in biofuels. The
EIU projects significant rises in Brazil and
Kazakhstan; the USEIA also projects the mix
of energy production in the Low Price Oil case
in 2035 would require renewables production
Figure 10 World marketed energy use by fuel type, USEIA
to double between 2007 and 2010. However,
doubling renewables production by 2030 requires significant investment in alternative energy,
an activity that, while popular until 2008 during record nominal oil prices, has been cut back
Figure 11 and 12 Historical and projected investment in sustainable energy, Bloomberg New Energy Finance
significantly as oil has recovered from highs and as countries embrace austerity measures.
Absent a significant uptick in new investment in sustainable energy, I project renewables
will increase at a slower rate of .5%-.7% annually. Accordingly, I project oil prices will most
closely resemble the USEIAʼs Base Case Oil price with prices reaching $110 by 2010.
11/29/10
10
Investment Thesis – Financial Analysis
Financial Analysis
Profitability Analysis
Profitability
2006
2007
2008
2009
TTM
Gross
Margin
31.4%
31.4%
29.2%
41.9%
42.4%
Operating
Margin
20.0%
19.3%
15.8%
10.8%
14.6%
8.1%
8.4%
8.7%
6.1%
8.4%
Return on
Assets
13.2%
13.2%
15.4%
6.4%
9.9%
Return on
Equity
26.0%
25.6%
29.2%
11.7%
17.4%
Free Cash
Flow /
Sales
5.0%
3.7%
3.6%
-0.3%
5.34%
Net
Margin
Despite gross margin and operating margin
steadily decreasing over the past five years
due to steady depletion of the most
accessible petroleum, Chevronʼs profitability
profile is strong. Over the same five year
period, their net margins have averaged in
the high single digits, indicating a level of
profitability in line with 2006-2008, and
achieved
despite
lower
oil
prices.
Additionally, Chevron generates a high level
of free cash flow beyond their dividend
payments, and over the past 12 months, it
has generated $5.34 per $100 of sales, a
level in line with pre-recession levels.
!
Peer Comparison
Chevronʼs profitability profile compares
strongly to their integrated peers,
displaying the highest Net Margin, the
second highest return on assets, and
4th highest return on equity. Their lead
position in Net Margin is indicative of
their success at focusing on upstream
operations. While Exxon Mobile is also
highly profitable, it also expensive on a
relative basis, trading at 12.2 times
current earnings.
Chevronʼs Net Margins will likely
increase as future investments are
made favoring upstream activity and
downstream assets are sold. In the
short run, over 2010 and 2011, oil
prices and stronger refining margins
should contribute to higher profitability
even as production costs rise from their
2009 levels.
!
!
!
!
!
!
11/29/10
Figure 13 Profitability in peer group
11
Investment Thesis – Financial Analysis
DuPont Analysis – Efficiency, Asset Management and Growth Prospects
+
DuPont Analysis
5Y Average
Profit Margin (Net Income / Revenue)
0.08
Total Asset Turnover (Revenue/ Assets)
1.34
Return on Investment
0.11
Profit Margin * Total Asset Turnover
Equity Multiplier (Avg Total assets/ Avg
Total Equity)
1.87
Average Total Assets / Average Total Equity
Return on Equity (ROI*Equity Multiplier)
0.210
2010E
0.08
1.13
0.10
2009
0.06
1.00
0.06
2008
0.09
1.63
0.15
2007
0.09
1.42
0.13
2006
0.08
1.53
0.13
1.75
1.81
1.89
1.92
1.96
0.17
0.12
0.28
0.24
0.25
+
The DuPont analysis describes the relation between Chevronʼs profit margins, asset utilization,
and leverage to describe operating management. Chevronʼs profit margins, as mentioned earlier
are high single digits, an area of financial leadership among its peers. Looking to Chevronʼs
asset turnover, they have been making progress since 2009, but still trail their 5 year average
following a strong 2006-2009 period. When viewed in conjunction with Chevronʼs asset turnover,
we can see how Chevronʼs return on investment stems from their profit margin per asset turn, to
produce a 9.89% Return on Investment, a 40% increase from 2009, and only 10% off of their 5
year average.
By evaluation Chevronʼs leverage, I arrived at their equity multiplier, a ratio describing
the amount of assets available per equity dollar. This number has lowered over the past 5 years,
and is below their 5 year average, an indication that they have reduced their overall leverage.
By dividing the return per dollar of assets by the equity multiplier, I calculated the return per
dollar of equity at 17.4%, a 45% increase from 2009. I project that their long term Return on
Equity will converge on their 5 year average of 21.0. I also used the return on equity to derive
the expected growth rate, as the amount of net income reinvested (61%), expected to earn the
2010 return on equity (16%) producing an implied growth rate of 10.15%.
,*-.*/*&0+1"/+,$#$213$+
2006
Current Ratio
1.28
Quick Ratio
1.02
Debt
PV of Operating Leases
+
2007
1.17
.9
2008
1.14
.79
Liquidity
+
2009
1.42
1.01
Adjusted Debt
Adjusted Debt to
Assets
3Q10
1.66
1.21
10,473
2,312
12,785
7.2%
Chevron has adjusted their liquidity to
provide for greater flexibility following
the credit crisis of 2008. Their current
ratio and quick ratio both provide
sufficient
liquidity,
particularly
considering their low total leverage,
even after taking into account the
present value of operating lease
obligations.
Financial Statement Projections
Appendix A presents selected financial statement data with projections for the next
three years.
11/29/10
12
Valuation
Valuation
Valuation through Comparables
10 Year
P/Forward E
P/S
P/B
P/EBITDA
P/CF
High
24.1
1.5
3.2
5.34
10.9
Low
5.6
0.4
1.4
2.37
3.8
Median
10.6
0.8
2.4
4.42
7
Current
Target
E/S/B/
Multiple EBITDA/CF
8.6
10.6
18,860
0.8
0.8
199.577
1.6
2.4
102,243
4.26
4.26
41,955
5.5
7
30,122
Weighted Target Equity Value
Shares outstanding
Price per Share
Predicted
EV
199,919
159,662
245,383
178,728
210,854
$203,815
2080
$97.99
Weight
22.5%
10.0%
22.5%
22.5%
22.5%
Through analyzing Chevronʼs historic valuation multiples, it becomes apparent that relative to
historic multiples, Chevron is trading at a significant discount, except on a Price to Sales basis.
However, as Chevron moves towards higher profitability upstream earnings, and away from
lower profitability downstream earnings, Price to Sales is the useful historic ratio. On each other
multiple examined, Chevron trades at a discount to the 10 year median, and significant discount
to 10 year highs. In considering weights, Price to Sales was reduced because of the incongruity
between upstream and downstream earnings and sales.
Also noteworthy is that Chevron is trading
at significantly lower multiples than the
S&P 500 and industry peers, despite
having the 2nd highest net margins, and
the highest return on assets over the past
12 months. This suggests that the
markets are undervaluing Chevron compared to its peers, despite Chevronʼs superior financial
performance. While multiples best provide historical context to overall valuation, they support
my discounted cash flow and sum of parts valuations.
Current Multiples
Price/Earnings
Price/Book
Price/Sales
Price/Cash Flow
Dividend Yield %
11/29/10
Chevron
9.80
1.60
0.80
5.50
3.50
Industry
14.70
1.80
0.80
6.70
3.40
S&P 500
15.10
2.00
1.30
7.60
1.90
13
Valuation
Valuation – Discounted Cash Flow
Appendix D presents my full discounted cash flow analysis, with which I arrive at an equity
value of $203.7B, $101.47 per share, a 23% upside from current levels. To generate my
discounted cash flow, I relied on the following assumptions.
Assumption
Description
Source
Market Assumptions
Cost of Debt
4.97%
Market Factor
6.00%; β =1.21
Size Factor
Book to Market Factor
Risk Free Rate
Debt to Assets
Final Cost of Equity
Adjustments
Operating Leases
Underfunded Pension
Operating Assumptions
Terminal Growth Rate
Sales Growth Rate
0.41%; β = .21
-1.46%, β = .73
4.22%
0.068
11.26%
Marginal Cost at S&P AA spread of .75 bps
over 30 Year
Implied Equity Risk Premium, 11/1/10,
Industry Average β
Kenneth French, 11/26/10
Kenneth French, 11/26/10
30 Year US Bond, 11/26/10
Lease Adjusted Debt
Fama-French Three Factor
1130
2496
Treated as Debt
Pension shortfall from Notes
Depletion, Depreciation, Amortization
3.7%
Increasing to 10.15% after 10
years
0.694% of CapEx
CapEx
21.6B, CAGR at 3.7%
Operating Margin
Increasing moderately to 11%
after 10 years
Moves to 48%
Reduced by $2B over 4 years
Projected GDP Growth - EIU
Implied by reinvestment rate (0.61) * return
on equity (16.6%)
Weighted (4:1) historic 10 year average of
Upstream CapEx:DDA 1.4x (80%) and
Downstream CapEx:DDA 1.6x (20%).
CVX Guidance, increase at terminal growth
rate
Reflecting shift towards Upstream
Tax Rate
Shares Outstanding
Reversion to company 5 year mean of 44%
Share buybacks.
I also analyzed my DCFʼs sensitivity to changes in discount rate and in terminal growth rate.
Note that using a higher discount rate or a slower growth rate, one could arrive very close to the
current stock price under my set of assumptions.
Discounted Cash Flow: Sensitivity Analysis
$101.47
Terminal
Growth
11/29/10
1.0%
1.5%
2.0%
2.5%
3.0%
3.7%
4.0%
4.5%
8.50%
124.39
130.29
137.09
145.03
154.41
170.82
179.42
196.61
9.00%
115.01
119.96
125.62
132.14
139.76
152.83
159.56
172.75
9.50%
106.77
110.96
115.71
121.14
127.40
137.99
143.35
153.71
Discount Rate
10.0%
10.5%
11.0%
99.48
93.00
87.19
103.06
96.07
89.85
107.08
99.50
92.79
111.64
103.36
96.09
116.85
107.74
99.80
125.53
114.95 105.84
129.88
118.51 108.80
138.17
125.25 114.34
11.27%
84.30
86.76
89.49
92.52
95.92
101.44
104.13
109.14
12%
77.24
79.26
81.47
83.92
86.64
91.00
93.10
96.98
12.50%
72.95
74.72
76.65
78.78
81.13
84.88
86.67
89.95
14
Valuation
Sum of Parts Valuation – Asset Value and Peer Composite
4.'+56+712&%+819.1&*5"+:+819.1&*5"+56+;)$#25"+<.%*"$%%+4$3'$"&%+
I performed a sum of parts valuation on Chevron reserves. The detailed valuation is provided in
Appendix C. This valuation was performed using available data from the SEC, and information
courtesy of JP Morgan. For upstream operations, I analyzed proven, probable and possible
reserves, including the recent Atlas Energy acquisition.
For the downstream valuation, I
assessed refining operations by region, regional capacities and average flow; I assessed
marketing by multiplying regional sites through JP Morgan estimates for valuation per site.
Chemical valuation was assessed by a multiple of peak earnings weighted for Chevronʼs equity
stake in Chevron Philips.
I then adjusted the value of gross operating assets by lease-adjusted net debt,
underfunded pension liabilities, and an expected value of Ecuadorian litigation at a probability of
1%. Through my sum of parts valuation, I assess Chevronʼs equity value at $187,640MM, or
$93.45 per share.
4.'+56+712&%+819.1&*5"+:+7$$2+;5'=5%*&$+
Sum of Parts Analysis
Segments
Petroleum Upstream
Petroleum Downstream
TOTAL
Sales per
Segment
P/S
Ratio
51328
142854
194182
Competitors P/S ratios
VQ
MWE
SD
NBR
3.0
2.6
2.4
1.7
SUN
0.14
0.882
HES
0.69
FTO
0.31
MUR
0.57
Target
P/S
Multiple
Current Stock
Price
# of diluted
shares
Target Price
% return to target
Value
2.43
124,727
0.4275
6,1070
0.957
Target Market Cap
Date of price
Segment
185,797
11/26/10
$82.05
2008
$92.53
13%
For the sum of parts peer composite, I divided Chevron sales by segment. For each segment, I
identified four pure play competitors, and calculated their Price to Sales ratios. These Price to
Sales ratios were averaged, and then multiplied by Chevron segment sales to estimate
expected segment market capitalization. The sum of the segment market capitalizations
indicates the segment-weighted expected market capitalization based on segment competitors
P/S ratios. This indicates that on a sales basis, Chevron is undervalued by 13%, even when
considering lower margin downstream sales.
11/29/10
15
Valuation
Valuation Composite of Scenarios
Valuation Ranges
52-week Trading Range
$66.83
$86.19
Multiples Analysis
$76.76
$117.97
Sum of Parts Assets and
Segment Comparables
Discounted Cash Flow
Analysis
$92.53
$72.95
11/26/10 Trading Range
$60.00
$93.45
$81.70
$70.00
$80.00
$82.60
$90.00
$100.00
$110.00
$120.00
Illustrative WMT Price per Share
min
$ 66.83
$ 76.76
$ 92.53
$ 72.95
$ 81.70
52-week Trading Range
Multiples Analysis
Sum of Parts Assets and Segment Comparables
Discounted Cash Flow Analysis
11/26/10 Trading Range
Valuation Composite
Value
Weight
DCF
SOP-Asset
SOP-Comp
Multiples
203,754
187,640
185,797
203,815
40%
40%
8%
12%
Composite
Shares
$ per share
Current Price
Upside
Upside %
19.36
41.21
0.92
123.66
0.90
max
$
86.19
$
117.97
$
93.45
$
196.61
$
82.60
Weighted $
81502
75056
14864
24458
$195,879
2080
$94.17
$82.05
$12.12
14.8%
Conclusion
Chevron is currently the inexpensive to their integrated peers, and offers a tremendous value
proposition. After reviewing pending litigation in Ecuador, an item currently creating a drag of $4
per share, my analysis indicates that any judgment that may result would be unenforceable in
the US under the Uniform Enforcement of Judgments Act. Combined with my oil price
projections tracking the US Energy Information Administrationʼs base case, and assessing the
spot value of Chevron reserves, I assign Chevron my a composite 12 month price target of
$94.17. Accordingly, I recommend Chevron (CVX) as a BUY with a 14.8% upside from its close
on November 26, 2010.
11/29/10
16
Valuation
>==$"/*?+
Appendix A – Selected Financials
Appendix B -Works Cited
1.
2.
3.
4.
5.
6.
7.
8.
Economist Intelligence Unit, Global Forecasting Service, December Update 2010
US Energy Information Administration, 2010 Energy Outlook
International Energy Agency, 2010 World Energy Outlook
Bloomberg New Energy Finance, Global Trends in Sustainable Energy Investment
JP Morgan, Upstream Deepdive 2010
Exxon Mobil 2009 Annual Report
Chevron 2009 Annual Report, 2009 10K, and 2010 Q1-Q3 10-Q
Atlas Energy 2009 Annual Report
11/29/10
17
Appendix
Appendix C – Sum of Parts – Valuation of Chevron Reserves
!"#$%&'"%(%"$%(
!"#$%&'(
'E'F(G
H:I:*6J:K
F7K:I:*6J:K
'E'G!G2
H:I:*6J:K
F7K:I:*6J:K
'E'GQ8)R0
H:I:*6J:K
F7K:I:*6J:K
'E'#5S:8
H:I:*6J:K
F7K:I:*6J:K
'E'T:7U)VRS:I86*)
H:I:*6J:K
F7K:I:*6J:K
'E'#5S:8'GQQ)*)05:1 H:I:*6J:K
F7K:I:*6J:K
'E'&67'R67I:75)670*G5S0D01R0'6)*'107K1
'E'G5*01'%7:8UW
T650*';%'<==>'J86I:7'8:1:8I:1
'E'Y68*K
,&012123
!86D0D*:'":1:8I:1'E'47K:I:*6J:K
!611)D*:'8:1:8I:1'E'47K:I:*6J:K
T650*'ZWK86R08D67'8:1:8I:1
-#%
'''OLX=@L
%486J:
F('/4*Q'26015
F('Y:15'26015
2070K0
G!G2'E':\'20*5:\
GQ8)R0
?IJK*L(KM0K"'%$#
#)*'+,,-.
/01'+-23./01'+-#%.$0*405)67
;%'<==>
';%'<==>'+-23?@AB.# )*'+C?DD*.
@@<<
<L@M
L>> C''''@NAM
<L>
LBM
OO
@OAM
><O
P=O<
BNL
NAP
<MP
<N>B
MB<
NAL
B<=
>NB
@O>
PAO
M<O
<=ML
LP<
PA<
<ON
L=P@
P<O
@=AN
@=P
PP<L
>P<
>A<
@<PO
@BL=
L@O
BA<
O>=
@==L
@NL
NAB
>N
NL
@L
MAB
PM
>>=
@N@
MAP
N<O
@O
BP=
@MN
O>NL
<OB>>
GI:80U:
PP><
@<===
<MPOP
>MBL
<B>OO
LBMMB
,089:5
$0*4:
$
@O
5,118
5,310
5,536
4,047
9,064
10,584
10,741
5,607
526
1,011
11,616
1,181
%&&&&&& !"#$
C''''''''@@=X>NM
<A<P
=A<P
20*5:\
GI:80U:'+[D6JK. C?D6JK
<@=
NAP
LL=
B
@PL
>
PP
N
@<M
P
ON
L
B
LMP
P=]
/'%=&$123
?@&(1A'B#
H$@&%
P=]'6Q'2S:I867'!S)*)J1'2S:[
`7R'2S:I867'#867)5:
!:09
%087)7U1
CDE
@AP
(S08:1 GC?(S
<N= .456788
C,,'J:8'1)5:
=AB
=AM
=AB
=AB
=AP
=AL
=A<
@
=AP
=AM
=A<
,4*5)J*:
<\
<M
@LB=
@M>NO
@PN@
@OPMN
/.,>-+:;<
LB=
LON@
@<@
ON
OMN
<>L
OO
P>@
L@B
P>P
@OP
NOM
B=L
BMB@
?F-/:?.G*
@=NB
_&/
/01'56'_)a4)K1
/*6D0*'!6^:8'/:7:805)67
268J'G11:51
/8611'G11:51
''''201S
''''H:D5
&:5'201S
!:71)67'6^:K
%\J:R5:K'$0*4:'6Q'2675)7U:7R):1
(4['6Q'J0851'%a4)5W'$0*4:
1S08:1
(#!%$?(S
11/29/10
LL>@B
@=<M@
C''''''''@PPX@LM
''''''''''''''LXN@N
C''''''''@PBXBP@
@PNP
<OM=
PM>>
LBP
L@==
LNL
,-9:;:;<
()5:'&4[D:8':\'GF
F('E'6^7:K'?'*:01:K
P=N
F('E'H)158)D45681'?'8:1:**:81
>@NB
2070K0
@O@
%F'E'6^7:K'?'*:01:K
BM
%F'E'K)158)D45681'?'8:1:**:81
@<>L
_G'E'6^7:K'?'*:01:K
>NN
_G'E'K)158)D45681'?'8:1:**:81
MM<
G!G2'E'#^7:K'?'*:01:K
P>@
G!G2'E'K)158)D45681'?'8:1:**:81
OLO
#5S:8'#_
@MBB
#5S:8'H"
@@==
_4D8)R0751
<P=@N
GI)05)67
27,143
13,491
!)J:*)7:1
!)*+,-./
&:5'20J0R)5W'+[D6JK.
<@=
LL=
O@@
PP
O<=
@<M
G1JS0*5
2S:I867'T8071J685
PP===
@OB===
<M>B>>
/01
+C?D6:.
C'''''''@>A@
@BA@
NAP
NAL
PAO
PA<
@@AB
@=A@
@AM
@AL
MAB
MAP
L@==
<MM@
@O<B
>L=
B=>>
C''''''''@>LX=PO
@=X>>P
@<NNL
E@N>=
E<M>O
E@@L=
C''''''''@BNXOM=
<==B
C''''''''''''>LAMP
18
Appendix
Appendix D
Discounted Cash Flow
Chevron (CVX)
Analyst: David Clark-Joseph
Date: 11/30/2010
(MM)
Year
Revenue
% Growth
Operating Income
Operating Margin
Terminal Discount Rate =
Terminal FCF Growth =
2010E
188,880
2011E
2012E
2013E
2014E
11.27%
3.7%
2015E
2016E
2017E
2018E
2019E
2010E
210,272 234,698 255,821 278,845 303,941 334,791 368,772 406,203 447,432 492,847
11.3%
11.6%
9.0%
9.0%
9.0%
10.2%
10.2%
10.2%
10.2%
10.2%
24,892
13.2%
24,370
11.6%
7,388
3.9%
8,390
4.0%
140
0.1%
147
0.1%
155
0.1%
256
0.1%
279
0.1%
304
0.1%
335
0.1%
369
0.1%
406
0.1%
447
0.1%
493
0.1%
Taxes
Tax Rate
14,120
43.8%
14,328
43.8%
14,620
43.8%
11,369
44.0%
12,515
44.0%
13,641
44.0%
15,173
44.0%
17,037
44.0%
19,124
44.0%
21,459
44.0%
23,637
44.0%
Net Income
% Growth
18,020
18,286
1.5%
18,660
2.0%
22,144
18.7%
23,456
5.9%
24,656
5.1%
26,676
8.2%
29,059
8.9%
32,464
11.7%
34,023
4.8%
36,983
8.7%
Add Deprc/Depl/Amort
% of Sales
Plus/(minus) Changes WC
% of Sales
Subtract Cap Ex
Capex % of sales
8,258
4.4%
1,213
0.6%
21,627
11.5%
11,565
5.5%
(632)
-0.3%
22,079
10.5%
11,970
5.1%
(722)
-0.3%
22,962
9.8%
16,583
6.5%
(767)
-0.3%
23,880
9.3%
17,247
6.2%
(837)
-0.3%
24,835
8.9%
17,937
5.9%
(912)
-0.3%
25,829
8.5%
18,654
5.6%
(1,004)
-0.3%
26,862
8.0%
19,400
5.3%
(1,106)
-0.3%
27,936
7.6%
20,176
5.0%
(1,219)
-0.3%
29,054
7.2%
20,983
4.7%
(1,342)
-0.3%
30,216
6.8%
21,823
4.4%
(1,479)
-0.3%
31,425
6.4%
5,864
7,140
21.8%
6,946
-2.7%
14,080
102.7%
15,031
6.8%
15,852
5.5%
17,464
10.2%
19,417
11.2%
22,368
15.2%
23,448
4.8%
25,903
10.5%
Other Income
Other Income % of Sales
Interest and Other
Interest % of Sales
Free Cash Flow
% Growth
NPV of Cash Flows
NPV of terminal value
Value of Operating Assets
Adjustments
Litigation Contingency
Probability of Contingencies
Expected Value
Pension Shortfall
Net Debt
Projected Equity Value
Free Cash Flow Yield
Current P/E
Projected P/E
Current EV/EBITDA
Projected EV/EBITDA
Shares Outstanding
Current Price
Implied equity value/share
Upside/(Downside) to DCF
Operating Lease Adjusted Debt
Cash
Cash/share
11/29/10
87,144
122,026
209,170
23,780
10.1%
26,094
10.2%
28,721
10.3%
31,306
10.3%
34,818
10.4%
39,090
10.6%
43,870
10.8%
49,218
11.0%
54,213
11.0%
9,655 7,674.63 7,528.81 7,294.58 7,365.40 7,375.44 8,124.05 6,711.48 6,899.85
4.1%
3.0%
2.7%
2.4%
2.2%
2.0%
2.0%
1.5%
1.4%
43%
60%
Terminal Value 354,936
Free Cash Yield
(113,000)
1.0%
(1,130)
(2,496)
(1,790)
203,754
7.30%
Terminal P/E
9.6
Terminal EV/EBITDA
4.7
3.56%
9.1
11.3
5.0
6.2
9.0
11.1
4.6
5.7
8.8
10.9
4.7
5.7
2,008
2,003.1
1,998.2
1,993.3
1988.36
1,983.5
1,978.6
1,973.8
101.72
101.97
102.22
102.47
102.73
102.98
103.23
$ 82.05
$ 101.47
23.7%
12,785
10,995
5.48
19
Analyst Bio
Analyst Bio
David Clark-Joseph is full time student pursuing a Masters of Business Administration at The Ohio State
University – Fisher College of Business. At Fisher, he is an active member of the Student Investment
Management program, which combines rigorous academic objectives with the practical demands of
institutional portfolio managers. With his 30 classmates, he manages $20.15 Million for the Ohio State
Endowment.
David is actively pursuing a career in investment management and transaction advisory, and is a
CFA Level I candidate. Before attending Fisher, he received a Juris Doctor from Florida State University,
and performed securitization and secured transaction work with Legal Services of North Florida and
served as a staff member in the Florida Senate Commerce Committee, analyzing corporate taxation and
industrial bonds.
11/29/10
20
