Alumni Outcomes # % # of Graduates Surveyed
advertisement
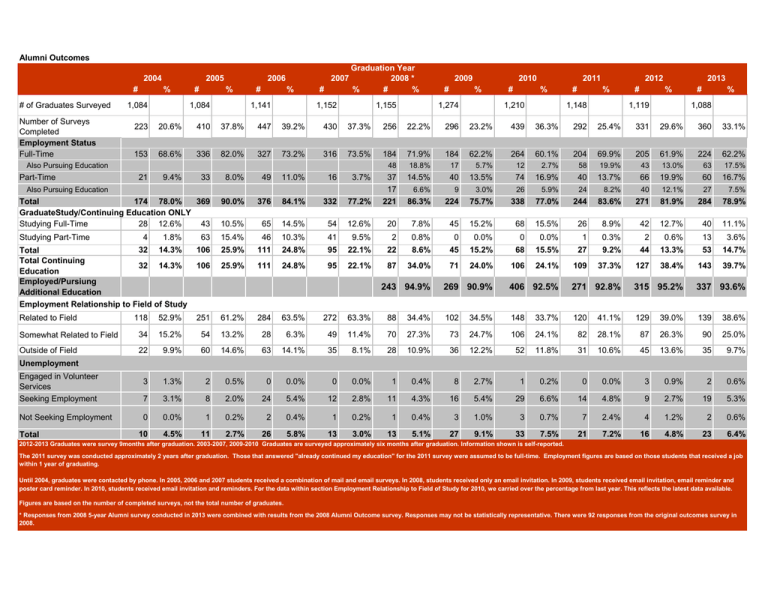
Alumni Outcomes 2004 # # of Graduates Surveyed Number of Surveys Completed Employment Status Full-Time 2005 % 1,084 # 2006 % 1,084 # 2007 % 1,141 # Graduation Year 2008 * % # % # 1,155 1,274 1,152 # 2011 % 1,210 # 2012 % 1,148 # 2013 % 1,119 # % 1,088 20.6% 410 37.8% 447 39.2% 430 37.3% 256 22.2% 296 23.2% 439 36.3% 292 25.4% 331 29.6% 360 33.1% 153 68.6% 336 82.0% 327 73.2% 316 73.5% 184 71.9% 184 62.2% 264 60.1% 204 69.9% 205 61.9% 224 62.2% 48 18.8% 17 5.7% 12 2.7% 58 19.9% 43 13.0% 63 17.5% 14.5% 40 13.5% 74 16.9% 40 13.7% 66 19.9% 60 16.7% 6.6% 9 3.0% 26 5.9% 24 8.2% 40 12.1% 27 7.5% 86.3% 224 75.7% 338 77.0% 244 83.6% 271 81.9% 284 78.9% 45 15.2% 68 15.5% 26 8.9% 42 12.7% 40 11.1% 33 8.0% 49 11.0% 16 3.7% 174 78.0% 369 Total GraduateStudy/Continuing Education ONLY 28 12.6% 43 Studying Full-Time 90.0% 376 84.1% 332 77.2% 37 17 221 21 9.4% 10.5% 65 14.5% 54 12.6% 20 7.8% Also Pursuing Education Studying Part-Time 2010 % 223 Also Pursuing Education Part-Time 2009 4 1.8% 32 14.3% Total Total Continuing 32 14.3% Education Employed/Pursiung Additional Education Employment Relationship to Field of Study 63 15.4% 46 10.3% 41 9.5% 2 0.8% 0 0.0% 0 0.0% 1 0.3% 2 0.6% 13 3.6% 106 25.9% 111 24.8% 95 22.1% 22 8.6% 45 15.2% 68 15.5% 27 9.2% 44 13.3% 53 14.7% 106 25.9% 111 24.8% 95 22.1% 87 34.0% 71 24.0% 106 24.1% 109 37.3% 127 38.4% 143 39.7% 243 94.9% 269 90.9% 406 92.5% 271 92.8% 315 95.2% 337 93.6% 118 52.9% 251 61.2% 284 63.5% 272 63.3% 88 34.4% 102 34.5% 148 33.7% 120 41.1% 129 39.0% 139 38.6% Somewhat Related to Field 34 15.2% 54 13.2% 28 6.3% 49 11.4% 70 27.3% 73 24.7% 106 24.1% 82 28.1% 87 26.3% 90 25.0% Outside of Field 22 9.9% 60 14.6% 63 14.1% 35 8.1% 28 10.9% 36 12.2% 52 11.8% 31 10.6% 45 13.6% 35 9.7% Related to Field Unemployment Engaged in Volunteer Services Seeking Employment 3 1.3% 2 0.5% 0 0.0% 0 0.0% 1 0.4% 8 2.7% 1 0.2% 0 0.0% 3 0.9% 2 0.6% 7 3.1% 8 2.0% 24 5.4% 12 2.8% 11 4.3% 16 5.4% 29 6.6% 14 4.8% 9 2.7% 19 5.3% Not Seeking Employment 0 0.0% 1 0.2% 2 0.4% 1 0.2% 1 0.4% 3 1.0% 3 0.7% 7 2.4% 4 1.2% 2 0.6% 10 4.5% 11 2.7% 26 5.8% 13 3.0% 13 5.1% 27 9.1% 33 7.5% 21 7.2% 16 4.8% 23 6.4% Total 2012-2013 Graduates were survey 9months after graduation. 2003-2007, 2009-2010 Graduates are surveyed approximately six months after graduation. Information shown is self-reported. The 2011 survey was conducted approximately 2 years after graduation. Those that answered "already continued my education" for the 2011 survey were assumed to be full-time. Employment figures are based on those students that received a job within 1 year of graduating. Until 2004, graduates were contacted by phone. In 2005, 2006 and 2007 students received a combination of mail and email surveys. In 2008, students received only an email invitation. In 2009, students received email invitation, email reminder and poster card reminder. In 2010, students received email invitation and reminders. For the data within section Employment Relationship to Field of Study for 2010, we carried over the percentage from last year. This reflects the latest data available. Figures are based on the number of completed surveys, not the total number of graduates. * Responses from 2008 5-year Alumni survey conducted in 2013 were combined with results from the 2008 Alumni Outcome survey. Responses may not be statistically representative. There were 92 responses from the original outcomes survey in 2008. 2005 2006 2007 2008 2011 Outcome 2012 2013 Survey Summary Alumni 2009 2010 100.0% 90.0% 94.9% 80.0% 82.0% 92.5% 92.8% 95.2% 93.6% 73.2% 70.0% 60.0% 90.9% 73.5% 68.6% 71.9% 60.1% 69.9% 61.9% 62.2% 62.2% Employed Part-time 50.0% Continuing Education 40.0% 24.8% 24.1% 24.0% 22.1% 37.3% 14.5% 14.3% 10.0% 0.0% 34.0% 25.9% 30.0% 20.0% Employed Full-time 9.4% 8.0% 2004 2005 11.0% 2006 16.9% 13.5% 39.7% 38.4% 19.9% Employed/Pursuing Education 16.7% 13.7% 3.7% 2007 2008 2009 2010 2011 2012 2013 Source: Alumni Outcomes Survey Full-Time Employment Status 100.0% 90.0% 80.0% 70.0% 60.0% 50.0% 40.0% 30.0% 20.0% 10.0% 0.0% Part-Time Employment Status 50.0% 50.0% 57.4% 50.0% 48.9% 44.7% 19.9% 13.0% 2.7% 2010 2011 2012 17.5% 2013 Full-time only Full-time with edu 40.0% 40.0% 30.0% 20.0% 10.0% 10.5% 10.9% 3.0% 0.0% 2009 Source: Alumni Outcomes Survey Additional Education Only 8.2% 5.9% 5.5% 2010 2011 12.1% 7.9% 2012 9.2% Part-time only 30.0% Part-time with edu 20.0% 10.0% 7.5% 2013 0.0% Full-time 15.5% 8.9% 15.2% 12.7% 0.0% 0.0% 0.3% 0.6% 2009 2010 2011 2012 11.1% 3.6% 2013 Part-time
