Document 10891492
advertisement
International Conference on Marine Data and Information Systems
23-25 September, 2013 - Lucca (Italy)
Trendylyzer: a Long-Term Trend Analysis
on Biogeographic Data
Ward Appeltans, Peter Pissierssens, IOC-UNESCO,
{w.appeltans, p.pissierssens}@unesco.org (Belgium)
Gianpaolo Coro, Angela Italiano, Pasquale Pagano, ISTI-CNR,
{gianpaolo.coro, angela.italiano, pasquale.pagano}@isti.cnr.it
Anton Ellenbroek, FAO, anton.ellenbroek@fao.org
Tom Webb, University of Sheffield, t.j.webb@sheffield.ac.uk
The United Nations General
Assembly
(A/RES/63/111)1
expressed its serious concern
over the current and projected
adverse effects of climate
change, pollution, overfishing
and habitat destruction on the
marine environment and marine
biodiversity. As a result, the UN
established a Regular Process
for Global Reporting and
Assessment of the State of the
Marine Environment Including
Socioeconomic Aspects, and
will publish its 1st World Ocean
Assessment in 20142. An entire section will be devoted to the status of marine biodiversity. A basic
metric of biodiversity is species composition. High species diversity is essential for maintaining
ecosystem functioning and could be regarded as one of the most important indicators on ocean’s
health. Unfortunately, assessing the global status of marine species is difficult because historical
data and accurate long-term time series on species occurences are scarce. One third to two thirds
of marine species are yet undiscovered3, and those species that are described are often known
from a single observation or are so rare that a scientific basis to make a meaningful assessment of
their status is lacking.
The Ocean Biogeographic Information System4 (OBIS) is an important source of information
on marine species diversity. OBIS is world’s largest global online open-access database on the
diversity, distribution and abundance of all marine life and can provide an important baseline,
against which future change can be measured. OBIS is one of the most used resources in marine
science and has been involved also in ecological modelling5 as well as in marine monitoring
systems6. OBIS is the data legacy of the decade-long Census of Marine Life, a US$ 650
million foundation-led project that gathered data from 2,700 scientists and 540 expeditions,
203
Session 3 - Data Services in ocean science
Oral presentations
and now operates under UNESCO’s Intergovernmental Oceanographic Commision as part of
its International Oceanographic Data and Informatoin Exchange (IODE) programme. OBIS has
continued to grow and has established a network of hundreds of data providers around the globe.
In total, it now integrates 1,130 datasets and holds 35 million observations of 120,000 marine
species.
In this paper we present Trendylyzer, a new marine species trend analysis tool using data from
OBIS. The aim of Trendylyzer is to provide indicators for use in marine biodiversity assessments.
Trendylyzer is a tool developed within the D4Science e-Infrastructure7 (currently co-funded by
the EU iMarine project8).
This is a Hybrid Data Infrastructure that aims at supporting large-scale resource sharing (both
hardware and software) and allows data to be processed with distributed computing. Data can
also be enriched with data coming from multiple sources, which are accessible through the eInfrastructure. Furthermore, the e-Infrastructure allows for the creation of Virtual Research
Environments (VREs), which are fully equipped web-based cooperation environments. Trendylyzer
will allow users to access the data through the e-Infrastructure, specify filters and groupings, select
a statistical analysis model, adjust the algorithm parameters (if any), and monitor the progress.
The results will be represented in a variety of formats and the selection of data, algorithms and
results will be summarised in a report.
Fig. 2 - Number of new species reported in OBIS per year (left)
and number of globally reported species (blue line) and occurrence records (red line) per year (right).
Trendylyzer will aim to answer questions such as:
1. Which are the most common marine species globally or by region and has this been changing
through time?
2. What are the current species gaps and how fast is this gap been filled with records of new
species in OBIS?
3. Do threatened or endangered species (based on the IUCN red list) occur in one or more
Marine Protected Areas (MPAs) and do the MPAs occur in the center or in the outer limits of the
species population range?
One of the challenges will be to define « common species » and to take into account sampling
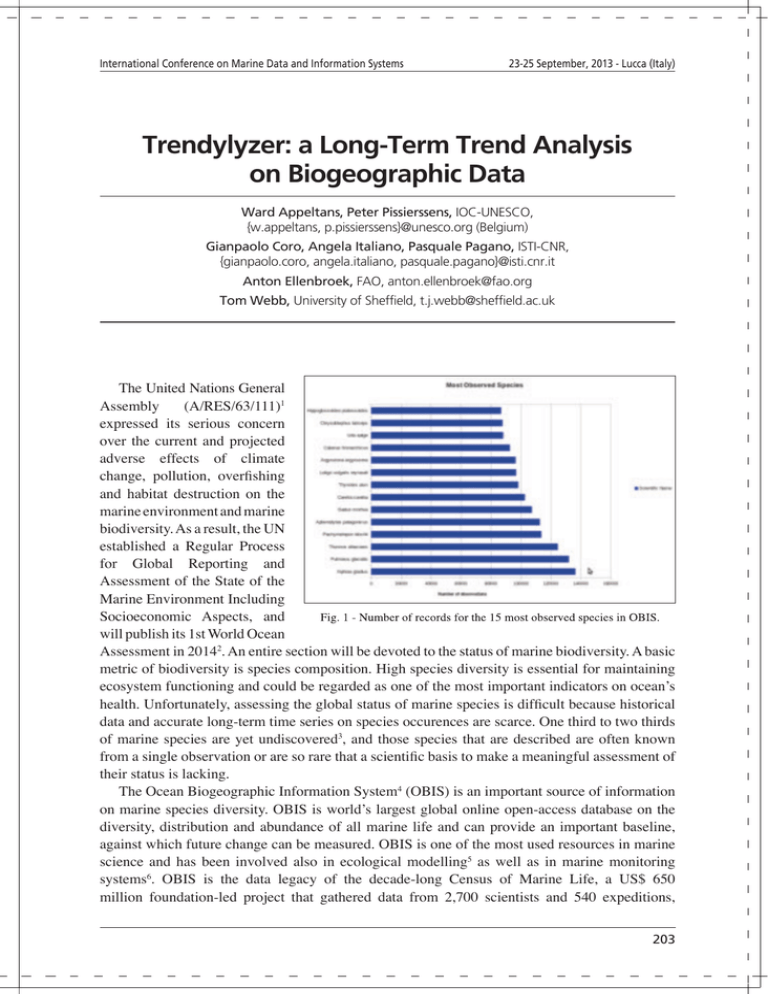
effort. Fig. 1 ranks the most observed species in OBIS. The list was produced by counting the
observations for each species. We merged the records that reported the same values for longitude,
204
International Conference on Marine Data and Information Systems
23-25 September, 2013 - Lucca (Italy)
latitude, depth, collector and recording time to filter out potential duplicates. Fig. 2 shows the
number of new species recorded in OBIS per year (left) and the global trend of the number of
species (blue line) and observations (red line) per year (right). Interestingly, the number of records
increases steadily, until it begins to level off around 1990 and the number of species declines
through the 1980s, but then increases subsequently.
A trend graph like the global number of species observed in each year is obviously biased by
the occurrence of rare species, but also by new species recorded in the database. Hence, a better
approach to discover shifts in biodiversity is to look at the pool of most common species. The
presented charts constitute preliminary analysis and future work will concentrate on more complex
analysis involving (i) a study of the trends per year for the most observed species, (ii) interactive
visualization facilities to fit data with proper representation metaphors, (iii) representations of new
species reports per geographical area and taxonomic group, and (iv) species status investigation
based on IUCN indications for MPAs. Trendylyzer is going to be released as an interactive web
application on the i-Marine project portal in a specific VRE, which will allow users to produce
charts and automatic reports and to share them with the i-Marine community of practice.
References
1
http://www.un.org/Depts/los/general_assembly/general_assembly_resolutions.htm
2
http://www.un.org/Depts/los/global_reporting/global_reporting.htm
3
Appeltans et al (2012). The magnitude of global marine species diversity. Current Biology,
22(23): 2189-2202
4
Intergovernmental Oceanographic Commission (IOC) of UNESCO. The Ocean Biogeographic
Information System. Web. http://www.iobis.org.
5
Owens, Bentley, and Peterson. (2012). Predicting suitable environments and potential occurrences
for coelacanths (latimeria spp.). Biodiversity and Conservation, 21: 577-587
6
Grothues (2009). A review of acoustic telemetry technology and a perspective on its diversification
relative to coastal tracking arrays. In Tagging and Tracking of Marine Animals with Electronic Devices,
pp 77-90
7
Candela, Castelli, and Pagano. (2009). D4Science: an e-Infrastructure for Supporting Virtual
Research Environments. In Agosti, Esposito, and Thanos (Eds), Post-proceedings of the 5th Italian
Research Conference on Digital Libraries - IRCDL 2009, pages 166-169
8
The i-Marine European Project, 2011. http://www.i-marine.eu.
205
