Model Based Corrections to Data from Radiation Damaged Detectors P. Bristow (ST-ECF)
advertisement
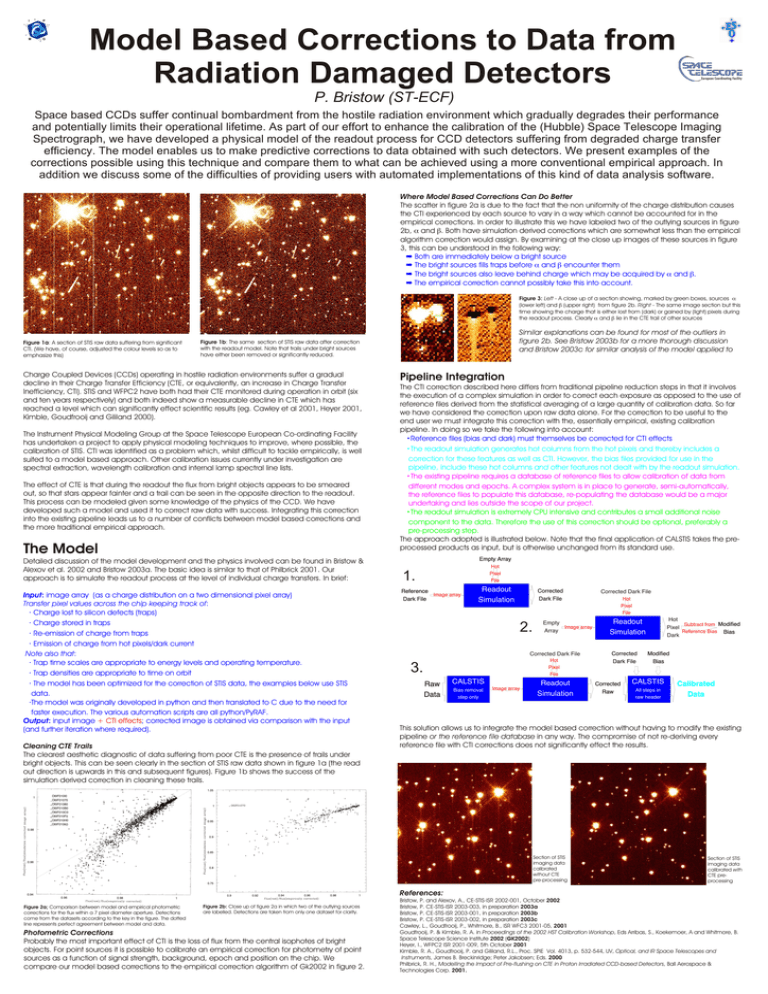
Model Based Corrections to Data from Radiation Damaged Detectors P. Bristow (ST-ECF) Space based CCDs suffer continual bombardment from the hostile radiation environment which gradually degrades their performance and potentially limits their operational lifetime. As part of our effort to enhance the calibration of the (Hubble) Space Telescope Imaging Spectrograph, we have developed a physical model of the readout process for CCD detectors suffering from degraded charge transfer efficiency. The model enables us to make predictive corrections to data obtained with such detectors. We present examples of the corrections possible using this technique and compare them to what can be achieved using a more conventional empirical approach. In addition we discuss some of the difficulties of providing users with automated implementations of this kind of data analysis software. Where Model Based Corrections Can Do Better The scatter in figure 2a is due to the fact that the non uniformity of the charge distribution causes the CTI experienced by each source to vary in a way which cannot be accounted for in the empirical corrections. In order to illustrate this we have labeled two of the outlying sources in figure 2b, a and b. Both have simulation derived corrections which are somewhat less than the empirical algorithm correction would assign. By examining at the close up images of these sources in figure 3, this can be understood in the following way: · Both are immediately below a bright source · The bright sources fills traps before a and b encounter them · The bright sources also leave behind charge which may be acquired by a and b. · The empirical correction cannot possibly take this into account. Figure 3: Left - A close up of a section showing, marked by green boxes, sources a (lower left) and b (upper right) from figure 2b. Right - The same image section but this time showing the charge that is either lost from (dark) or gained by (light) pixels during the readout process. Clearly a and b lie in the CTE trail of other sources Figure 1a: A section of STIS raw data suffering from significant CTI. (We have, of course, adjusted the colour levels so as to emphasize this) Figure 1b: The same section of STIS raw data after correction with the readout model. Note that trails under bright sources have either been removed or significantly reduced. Charge Coupled Devices (CCDs) operating in hostile radiation environments suffer a gradual decline in their Charge Transfer Efficiency (CTE, or equivalently, an increase in Charge Transfer Inefficiency, CTI). STIS and WFPC2 have both had their CTE monitored during operation in orbit (six and ten years respectively) and both indeed show a measurable decline in CTE which has reached a level which can significantly effect scientific results (eg. Cawley et al 2001, Heyer 2001, Kimble, Goudfrooij and Gililand 2000). The Instrument Physical Modeling Group at the Space Telescope European Co-ordinating Facility has undertaken a project to apply physical modeling techniques to improve, where possible, the calibration of STIS. CTI was identified as a problem which, whilst difficult to tackle empirically, is well suited to a model based approach. Other calibration issues currently under investigation are spectral extraction, wavelength calibration and internal lamp spectral line lists. The effect of CTE is that during the readout the flux from bright objects appears to be smeared out, so that stars appear fainter and a trail can be seen in the opposite direction to the readout. This process can be modeled given some knowledge of the physics of the CCD. We have developed such a model and used it to correct raw data with success. Integrating this correction into the existing pipeline leads us to a number of conflicts between model based corrections and the more traditional empirical approach. The Model Detailed discussion of the model development and the physics involved can be found in Bristow & Alexov et al. 2002 and Bristow 2003a. The basic idea is similar to that of Philbrick 2001. Our approach is to simulate the readout process at the level of individual charge transfers. In brief: Input: image array (as a charge distribution on a two dimensional pixel array) Transfer pixel values across the chip keeping track of: · Charge lost to silicon defects (traps) · Charge stored in traps · Re-emission of charge from traps · Emission of charge from hot pixels/dark current Note also that: · Trap time scales are appropriate to energy levels and operating temperature. · Trap densities are appropriate to time on orbit · The model has been optimized for the correction of STIS data, the examples below use STIS data. ·The model was originally developed in python and then translated to C due to the need for faster execution. The various automation scripts are all python/PyRAF. Output: input image + CTI effects; corrected image is obtained via comparison with the input (and further iteration where required). 0.98 Pipeline Integration The CTI correction described here differs from traditional pipeline reduction steps in that it involves the execution of a complex simulation in order to correct each exposure as opposed to the use of reference files derived from the statistical averaging of a large quantity of calibration data. So far we have considered the correction upon raw data alone. For the correction to be useful to the end user we must integrate this correction with the, essentially empirical, existing calibration pipeline. In doing so we take the following into account: • Reference files (bias and dark) must themselves be corrected for CTI effects • The readout simulation generates hot columns from the hot pixels and thereby includes a correction for these features as well as CTI. However, the bias files provided for use in the pipeline, include these hot columns and other features not dealt with by the readout simulation. • The existing pipeline requires a database of reference files to allow calibration of data from different modes and epochs. A complex system is in place to generate, semi-automatically, the reference files to populate this database, re-populating the database would be a major undertaking and lies outside the scope of our project. • The readout simulation is extremely CPU intensive and contributes a small additional noise component to the data. Therefore the use of this correction should be optional, preferably a pre-processing step. The approach adopted is illustrated below. Note that the final application of CALSTIS takes the preprocessed products as input, but is otherwise unchanged from its standard use. Empty Array 1. Reference Image array Dark File Readout Simulation Corrected Dark File 2. 3. Cleaning CTE Trails The clearest aesthetic diagnostic of data suffering from poor CTE is the presence of trails under bright objects. This can be seen clearly in the section of STIS raw data shown in figure 1a (the read out direction is upwards in this and subsequent figures). Figure 1b shows the success of the simulation derived correction in cleaning these trails. 1 Similar explanations can be found for most of the outliers in figure 2b. See Bristow 2003b for a more thorough discussion and Bristow 2003c for similar analysis of the model applied to Empty Image array Array Corrected Dark File Raw Data CALSTIS Bias removal step only Image array Readout Simulation Corrected Dark File Readout Simulation Corrected Dark File Corrected Raw Hot Subtract from Modified Pixel Reference Bias Bias Dark Modified Bias CALSTIS All steps in raw header Calibrated Data This solution allows us to integrate the model based correction without having to modify the existing pipeline or the reference file database in any way. The compromise of not re-deriving every reference file with CTI corrections does not significantly effect the results. 1.05 O6IF010I0 O6IF01070 O6IF01080 O6IF010B0 O6IF010C0 O6IF010F0 O6IF010H0 O6IF010K0 1 0.95 0.9 0.85 0.96 0.8 0.75 0.94 0.96 0.98 1 Figure 2a; Comparison between model and empirical photometric corrections for the flux within a 7 pixel diameter aperture. Detections come from the datasets according to the key in the figure. The dotted line represents perfect agreement between model and data. 0.9 0.92 0.94 0.96 0.98 1 Figure 2b: Close up of figure 2a in which two of the outlying sources are labelled. Detections are taken from only one dataset for clarity. Photometric Corrections Probably the most important effect of CTI is the loss of flux from the central isophotes of bright objects. For point sources it is possible to calibrate an empirical correction for photometry of point sources as a function of signal strength, background, epoch and position on the chip. We compare our model based corrections to the empirical correction algorithm of Gk2002 in figure 2. References: Section of STIS imaging data calibrated without CTE pre-processing Section of STIS imaging data calibrated with CTE preprocessing Bristow, P. and Alexov, A., CE-STIS-ISR 2002-001, October 2002 Bristow, P. CE-STIS-ISR 2003-003, in preparation 2003a Bristow, P. CE-STIS-ISR 2003-001, in preparation 2003b Bristow, P. CE-STIS-ISR 2003-002, in preparation 2003c Cawley, L., Goudfrooij, P., Whitmore, B., ISR WFC3 2001-05, 2001 Goudfrooij, P. & Kimble, R. A. in Proceedings of the 2002 HST Calibration Workshop, Eds Arribas, S., Koekemoer, A and Whitmore, B. Space Telescope Science Institute 2002 (GK2002) Heyer, I., WFPC2 ISR 2001-009, 5th October 2001 Kimble, R. A., Goudfrooij, P. and Gililand, R.L., Proc. SPIE Vol. 4013, p. 532-544, UV, Optical, and IR Space Telescopes and Instruments, James B. Breckinridge; Peter Jakobsen; Eds. 2000 Philbrick, R. H., Modelling the Impact of Pre-flushing on CTE in Proton Irradiated CCD-based Detectors, Ball Aerospace & Technologies Corp. 2001.
