Document 10861459
advertisement
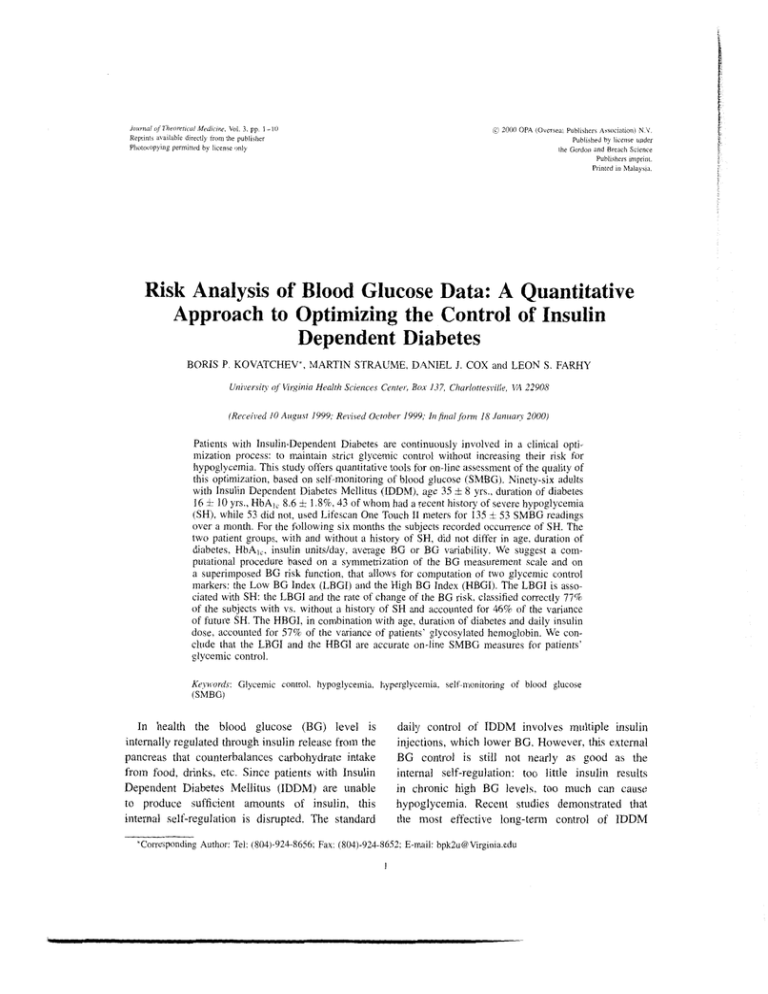
Jonrr~rilrf Theoretrial M f d ~ c i t ~ eVoi. , 3. pp 1- 10 Reprmh a\.a~lnbiedirectly trom the publ~rhcr Phutocopymg perm~ttedby lrcense only C 2000 OPA (Overseas Pubhiher\ Aswcintmn) N V. Pubhshed by l~censeunder the Gordon and Breach Saence Publihers m~print. Prmted In M a l a y m Risk Analysis of Blood Glucose Data: A Quantitative Approach to Optimizing the Control of Insulin Dependent Diabetes BORIS P. KOVATCHEV*, MARTIN STRAUME, DANIEL J. COX and LEON S. FARHY Urziversi@of Virginia Health Sciences Center, Box 1-37, Charlottesvilir, VA 22903 (Recerved 10 Augu\t 1999, Revrted October 1999, Itzjnal form 18 Januan 2000) Patients with Insulin-Dependent Diabetes are continuously involved in a clinical optimization process: to maintain strict glycemic control without increasing their risk for hypoglycemia. This study offers quantitative tools for on-line assessment of the quality of this optimization, based on self-monitoring of blood glucose (SMBG). Ninety-six adults with Insulin Dependent Diabetes Mellitus (IDDM), age 35 8 yrs., duration of diabetes 16 10 yrs., HbAl, 8.6 i 1.8%, 43 of whom had a recent history of severe hypoglycemia (SH), while 53 did not, used Lifescan One Touch I1 meters for 135 i 53 SMBG readings over a month. For the following six months the subjects recorded occurrence of SH. The two patient groups, with and without a history of SH, did not differ in age, duration of diabetes, HbA,,, insulin unitslday. average BG or BG variability. We suggest a computational procedure based on a symnletrization of the BG measurement scale and on a superimposed BG risk function, that allows for computation of two glycemic control markers: the Low BG Index (LBGI) and the High BG Index (HBGI). The LBGI is associated with SH: the LBGl and the rate of change of the BG risk, classified correctly 77% of the subjects with vs. without a history of SH and accounted for 46% of the variance of future SH. The HBGI, in combination with age, duration of diabetes and daily insulin dose, accounted for 57% of the variance of patients' glycosylated hemoglobin. We conclude that the LBGI and the HBGI are accurate on-line SMBG measures for patients' glycemic control. + + Keywords: Glycemic control, hypoglycemia, hyperglycernia, self-monitoring of blood glucose (SMBG) In health the blood glucose (BG) level is internally regulated through insulin release from the pancreas that counterbalances carbohydrate intake from food. drinks, etc. Since patients with Insulin Dependent Diabetes Mellitus (IDDM) are unable to produce sufficient amounts of insulin, this internal self-regulation is disrupted. The standard daily control of IDDM involves multiple insulin injections, which lower BG. However, this external BG control is still not nearly as good as the internal self-regulation: too little insulin results in chronic high BG levelc, too much can cause hypoglycemia. Recent studies demonstrated that the most effective long-term control of IDDM *Corresponding Author: Tel: (803)-924-8656;Fax: (804)-924-8652;E-mail: bpk2u@Virginia.edu 2 B. P. KOVATCHEV rt al. is the strict maintenance of BG levels within a normal range through intensive insulin therapy. DeCailed results of its effects are presented by the Diabetes Control and Complications Trial Research Group (DCCT) (1993) and its European counterpart (Reichard and Phil, 1994): chronic high BG levels were proven to cause many complications in multiple body systems over time, while too much insulin resulted in hypoglycemia. Without immediate treatment hypoglycemia can rapidly progress to severe hypoglycemia (SH), a condition defined as an episode of neuroglycopenia which precludes self-treatment and requires external help for resuscitation (DCCT Research Group, 1997). On one side, intensive therapy is the best longterm treatment of IDDM, on the other it was associated with at least a threefold increase in SH (Reichard and Phil, 1994; DCCT Research Group, 1997). Since SH could result in accidents, coma and even death, it discourages patients and health care providers from pursuing intensive therapy. Consequently, hypoglycemia has been identified as the major barrier to improved glycemic control (Cryer, 1993; Cryer, Fisher and Shamoon, 1994). In short, patients with IDDM face a life-long clinical optimization problem: to maintain strict glycemic control without increasing risk for hypoglycemia. A bio-mathematical problem, associated with this optimization is to create a measure, based on multiple BG readings that quantifies both trends: towards chronically high BG levels and towards increased risk for hypoglycemia. Traditionally, patients' glycemic control is assessed through measurement of glycosylated hemoglobin (HbA1 or HbA1,), an accepted biochemical marker for average BG levels over the preceding two months (Svendsen et al., 1982; Santiago, 1993). High glycosylated hemoglobin is associated with chronically high BG levels and therefore, this measure sets the reference standard for control of BG with respect to hyperglycemia. However, HbA1, was repeatedly proven to be ineffective for assessment of patients' risk for hypoglycemia (DCCT Research Group, 1991; Gold ef al., 1997; Cox et al. 1994). In fact, the DCCT concluded that only about 7% of future SH episodes can be predicted from known variables, including HbA,, (DCCT Research Group, 1997), and this prediction was improved to 18% using a recent structural equations model (Gold et al., 1997). The reason for that poor prediction is quite understandable - HbAI, reflects the average BG level over a few weeks preceding the measurement, but is not sensitive to the relatively quick and sharp BG transitions in the lower BG range that are respt-msible for SH. In a previous publication we reported that a new risk measure, the Low BG Index, based on a normalizing transformation of BG data (Kovatchev et al., 1997), can predict 40% of future SH episodes (Kovatchev et al., 1998). In this manuscript we offer a numerical approach to the clinical optimization problem related to IDDM, based on the following idea: The struggle for tight glycemic control often results in great BG fluctuations over time. This process is influenced by many external factors, including the timing and amount of insulin injected, food eaten, physical activity, etc. In other words, fluctuations of the BG level over time are the measurable result of the action of a complex dynamic system, influenced by many internal and external factors. Observed at a macro-level, such a system has a random behavior, which includes quick transitions (such as SH episodes) to extreme areas of its state space. An appropriate evaluation of stationary and nonstationary cl~aracteristics of this random process would identify measures for both chronically high and very low BG levels, as well as a measure for the overall glycemic control of the patient. In order to be clinically useful, these markers need to be computed on readily available data through relatively simple algorithms. In order to be clinically proven, these markers need to correlate with established glycemic control measures, such as HbAIc, and be sensitive to the risk for upcoming SH. We will first derive from a set of clinical assumptions a skewness-correction transformation for BG data. Then, on that basis, we will suggest a BG risk function and two related statistics: the Low and High BG Indice~.~To incorporate the temporal behavior of RISK ANALYSIS OF BLOOD GLUCOSE D.4TA the system we introduce two statistics, related to the rate of change of the BG risk: the indices SDn and S u p , which are measures of how fast the BG risk function increases and decreases, respectively. All indices will be computed from memory meter data, automatically stored during routine home BG selfmonitoring. We will refer to previous reports and reanalyze existing data to validate our data transformation, evaluate the relationship between the Low BG Index, SUp and SDn and hypoglycemia and between the High BG Index and patients' glycosylated hemoglobin. We will conclude that the Low and High BG Indices offer numerically comparable assessments of the risk for hypoglycemia and hyperglycemia, respectively, that can be combined in a single measure of overall glycemic control. RESEARCH DESIGN AND METHODS Subjects Ninety-six individuals, 58 women and 38 men, who had IDDM for at least two years and were taking insulin since the time of diagnosis were recruited through advertisement in newsletters, diabetic clinics, and through direct referrals. All subjects were routinely using self-monitoring devices to measure their BG.Their average age at the time of recruitment was 35 years (SD = 8), the average duration of diabetes was 16 years (SD = 10) and the average daily insulin dose was 0.58 units per kilogram (SD = 0.19). Since the goal of this research was to study risk factors for SH, subjects who had problems with recurrent SH were preferentially recruited. History of SH was recorded as the number of SH episodes in the previous year. The preferential recruitment resulted in 43 participants who reported having at least two SH episodes in the previous year, and 53 who reported none. These two groups will be referred to as SH and No SH in the text. The SH group included 45% of all subjects, which is greater than the estimated 4% to 22% frequency of IDDM patients who have problems with SH (DCCT, 1997). Consequently, the incidence of SH in this study 3 was high compared to reports from population-based studies. Procedure After an initial screening assessment, the subjects' usual BG meters were replaced by Lifescan OneTouch I1 memory meters that can store up to 250 BG readings. The study proceeded with one month of home self-monitoring of BG (SMBG)that yielded on average 135 BG readings per subject (SD = 53). At one-month meetings the participants' BG data were downloaded for analysis and blood was drawn for HbA,, determination. The average glycosylated hemoglobin was 8.6, SD = 1.8%. During the following six months all participants recorded in diaries occurrence of moderate or severe hypoglycemia. These diaries were mailed in monthly and resulted, on average, in 2.3 records of SH episodes per subject (SD = 4.8). SH occurred predominantly in subjects from the SH group who reported 4.8 (SD = 7.0) SH episodes on average. Symmetrization of the BG Measurement Scale The BG levels are measured in mgldl in the USA and in mmol/L (or mM) most elsewhere. Throughout this paper we employ the mM scale. The two scales are directly related by: 18 mgldl = 1 mM. The whole range of most BG reference meters is I. 1 to 33.3 mM, which is considered to cover practically all observed values. According to the recommendations of the DCCT (1993), the target BG range for a person with IDDM is considered to be 3.9 to 10 mM. Hypoglycemia is identified as a BG below 3.9 mM, hyperglycemia is a BG above 10 mM. It is obvious that this scale is not symmetric - the hyperglyceniic range (10 to 33.3 mM) is much greater that the hypoglycemic range (1 .I -3.9 mM) and the euglycemic range (3.9-10 mM) is not centered within the scale. As a result the numerical center of the scale (17.2 mM) is distant from its "clinical center" - the clinically desired clustering of the BG values of patients with diabetes around 6-6.5 mM. In a previous report we suggested that B. P. KOVATCHEV et a1 4 this asymmetry of the scale leads to skewed distributions of patients' BG readings, and suggested a scale transformation that corrects the problem (Kovatchev ~t al., 1997). The mathematics of thls transformation is based on two clinical assumptions: A l ) The transformed whole BG range should be symmetric around zero. A2) The transformed target BG range should be symmetric around zero. In other words, let .f(BG) be a continuous function defined on the BG range [ 1.1, 33.31 that has the general two-parameter analytical form calibration of the BG risk function from 0 to 100 (see the next section). This scaling and the assumptions A1 and A2 lead to the equations which are easily reduced to a single nonlinear equation for the parameter a . When solved numerically under the restriction a > 0, it gives: a = 1.026, P = 1.861 and y = 1.794T. f (BG , a . f i ) = [(ln(BG))" - $1. a, 0 > 0 Figure 1 presents the graph of f(BG) = 1.794 [ ( l n ( ~ G ) )026 ' - 1.8611. The whole BG range is transthat satisfies the conditions A l : f (33.3, a , P ) = -f(I.l.o,p) and A2: f ( l O , a , P ) = - j ( 3 . 9 . c ~ , @ ) . formed into the symmetric interval [-Jl?j, The target BG range is transformed into the The logarithmic form o f f (BG, a , 8) is intuitively symmetric interval [-0.9,0.9]. Since f (6.25) = 0, justified by the fact that the BG level is a the transformation brings together (and sets to concentration of sugar in the blood, and therefore zero) the numerical and the clinical center of the would have a generally logarithmic presentation. BG scale. In the discussion we will also see that this form can be deduced from the classic Box-Cox skewness correction transformation (Box and Cox, 1964), The BG Risk Function if we impose the assumptions A1 and A2. By multiplying by a third parameter y we fix the After fixing the parameters of f (BG) depending minimal and maximal values of the transformed on the measurement scale that is being used, we BG range at and v% respectively. These define the quadratic function r(BG) = ~ O $ ( B G ) ~ . values are convenient for two reasons: first, a t If BG is measured in mgldl, by replacing in the equations random variable with a central normal distribution 33.3 m M by 600 mgldl, 1.1 mM by 20 mgldl. 10 mM by would have 99.8% of its value\ within the interval 180 mgtdl, and 3.9 m M by 70 mgldl, we obtain cu = 1.084, ,j = 5.381, +j = 1.509. and second, this provldes a nice m]. -m [-m,m], 3.5 3 2.5 2 1.5 1 3 0.5 0 g-0.5 -1 -1.5 -2 -2.5 -3 -3.5 --e transformedscale -- p~ 1 4 7 10 13 16 19 22 25 -- 28 -- 31 34 BG (mM) FIGURE 1 Transforming the blood glucose: the whole BG range and the target BG range are transformed into symmetric around zero intervals. The hypoglycemic and hyperglycemic ranges become symmetric. The numerical and the clin~calcenter of the scale coincide after the transformation and are equal to zero. RISK ANALYSIS O F BLOOD GLUCOSE DATA Figure 2A presents the graph of r(BG) over the transformed hypoglycemic, target and hyperglycemic BG ranges. Figure 2B presents r(BG) in the original BG scale. The function r ( B G ) ranges from 0 to 100. Its minimum value is achieved at BG = 6.25 mM, a safe euglycemic BG reading, while its maximum is reached at the extreme ends of the BG scale. Thus, r ( B G ) can be interpreted as a measure of the risk associated with a certain BG level. The left branch of this parabola identifies the risk of hypoglycemia, while the right branch identifies the risk of hyperglycemia. Based on that, we define the Low and the High BG Indices as follows: 5 Let x ~~ ,2 :. . ,x,, be n BG readings of a subject and let rl(BG) = r ( B G ) i f f ( B G ) < 0 and 0 otherwise: rh(BG) = r ( B G ) iff ( B C ) > 0 and 0 otherwise. The Low Blood Glucose [Risk] Index (LBGI) and the High BG [Risk] Index (HBGI) are then defined as: LBGI = I 1-1(i,) and I1 1=I 1 HBGI = n viz(x,) respectively i= l Clinical and 40 " -3 -2.5 -2 -1.5 -1 -0.5 0 0.5 1 1.5 2 2.5 3 Transformed BG Scale f(5G) FIGURE 2a The blood glucose r ~ s kfunct~onas defined on the transformed BG scale. The values of r ( B G ) at the left part of the 5cale ithe Hypoglycemic range) are refened to a\ Low BG Rlsk, while the values at the nght part of the scale (the Hyperglycemic range) are referred to as ~ i g BG h Risk. BG Level (mM) FIGURE 2b The blood glucose risk function plotted over the standard BG scale. 6 B. P. KOVATCHEV et al. In other word\, the LBGl i\ a non-negative quantity that increa\es when the number and/or extend of low BG readings increa\es. Similarly, the HBGI increases when the number andtor extend of high BG readings increases. The sum of LBGI + HBGI has a theoretical upper limit of 100. RESULTS BG Scale Transformation The scale transformation f (BG) was applied to all 96 memory meter data sets. A Kolmogorov-Smirnov test was used to fit a normal distribution to each individual sample. With a significance level of 0.01, only five out of 96 hypotheses that a normal distribution fits the transformed data were rejected. By the same criteria, the transformed data had a closer to normal distribution than the original BG readings in 70 out of 96 cases. This confirms our previous report in which f(BG) normalized 203 out of 205 individual BG data sets (Kovatchev e t a / . , 1997). Low BG Index The LBGI was previously used to differentiate subjects with and without a history of SH and to predict future SH episodes. We demonstrated that the LBGI is one of the best predictors of future SH accounting (in combination with history of SH) for 40% of the variance of future SH episodes (Kovatchev et al., 1998). Now, with these data, we computed the LBGI for each subject and estimated the speed of BG risk changes in the lower BG range (BG < 6.25 mM) as follows: We first transformed the memory meter data of each subject using the function f(BG). Then cubic splines were used to interpolate the transformed readings and to produce estimates of J"(BG) at one-hour increments. Based on this interpolation we estitnated SDn as the average change of rl (BG) within one hour when BG goes down, and S u p as the average change of rl(BG) within one hour when BG goes up (Thus, SDIZis positive, while S u p is negative, since in the lower BG range the risk function increases as BG goes down). For more details on the calculation of SDil and SUp and some related comments see the Appendix. Retrospectively, age, duration of diabetes, HbA],, insulin unitstday, average BG and BG variability (defined as the standard deviation of the BG readings) did not differentiate SH from NOSH subjects. A t-test demonstrated that subjects with a history of SH had significantly higher LBG1, 5.2 (SD = 3.3) vs. 2.0 (SD = 1.8), t = 4.2, p < 0.00 1. The rate of BG risk changes SDn and SUp were also greater (by absolute value) for the SH group, 2.5 (SD = 1) vs. 1.9 (SD = 0.9) and -2.5(SD = 1.1) vs. -- 1.8(SD = 0.8), both p's < 0.01, indicating sharper risk transitions in the low BG range. A significant discriminant model (Chi-square = 22.5, p < 0.0001) using the three variables LBGI, SDn and S u p classified correctly 77% of the subjects with vs. without a history of SH. Prospectively, a significant regression model (F = 17.5. P < 0.0001) using LBGI, SDn, SUP and history of SH had an R* = 46%, e.g. accounted for 46% of the variance of future SH. This represents a 6% increase over our previous report (Kovatchev et dl., 1998) based on LBGI and history of SH. Both SDn and Sup had a significant contribution to this classification/prediction that is linearly independent from LBGI and SH history. No other variables (e.g. HbA,,, age, diabetes duration, HBGI, etc.) had any additional contribution. High BG Index As it was to be expected, the HBGI was significantly correlated with patients' glycosylated hemoglobin, r = 0.7, p < 0.001. A significant regression model (F = 29, p < 0.0001) using HBGI, age, duration of diabetes and patients' daily insulin dose accounted for 57% of the variance of HbA],. HBGI was the most significant variable of this regresuion, t = 10.0, p < 0.0001. The relationship between the HBGI and HbA,, was approximately linear, approximated with a piecewise line with two cutpoints, HBGI = 4.5 and RISK ANALYSIS OF BLOOD GLUCOSE DATA 5 0 1 = H ~ A I BG 10 J 15 20 25 High BG Index FIGURE 3 Relationships between average BG, HbA,, and High BG Index HBGI = 9 that ma1.ked changes in the slope of the relationship (Figure 3). Based on these cutpoints we identify three high BG risk zones: HBGI < 4.5, HBGI between 4.5 and 9 and HBGI above 9. This is similar to the procedure we previously reported for the LBGI - the risk for SH was classified within three zones LBGI < 2.5, LBGI between 2.5 and 5 and LBGI above 5 (Kovatchev rt al., 1998). These classifications allow for an assessment of the overall glycemic control of a patient with IDDM, based on memory meter data. Table I is constructed as follows: Vertically we present the three SH risk groups based on the LBGI, horizontally we present the high BG risk groups, based on HBGI. In each cell of the table we present four numbers: the average (per subject) number of retrospectively/prospectively reported SH episodes, average HbA1, and the number of subjects. TABLE I HBGI Glycemic Control Evaluation Based on LBGI and HBGI <4.5 <2.5 LBGI 2.5 - 5.0 >5.0 4.5-9.0 >9.0 SH: 0/0 8.3%/n = 7 SH: 1.2/0.1 8.9%/n = 9 SH: 1.410.7 9.9%/n = 20 SH: 1.310 7.3%/11 = 6 SH: 4.912.2 X.6c/r/n = 20 SH: 4.413.6 9.5%/n = 12 SH: 4.714.3 7.0%/n = 17 SH: 15.315.7 8.0%/11 = 3 SH: 15.0112.0 7.6%/r1 = 2 It is intuitively clear that the patients in cell (1,l) should have the best glycemic control. Indeed, these seven subjects reported 0 SH episodes (retrospectively and prospectively) and had HbA,, = 8.3%. As expected, the glycosylated hemoglobin increases horizontally from left to right and the number of SH episodes increases vertically from top to bottom. 3 x 3 ANOVA demonstrated that all three variables significantly differed between the cells of Table I: History of SH, F = 6.7, p < 0.001; Prospective SH episodes, F = 4.0, p = 0.005; HbA,,, F = 9.6, p < 0.001. However, LBGI was not a significant effect for the glycosylated hemoglobin and HBGI was not a significant effect for the number of prospective SH episodes. DISCUSSION This investigation offers quantitative tools for studying the clinical optimization problem for improvement in glycernic control without increasing the risk of SH. In general, there are two mathematical approaches to that problem. The first approach would be to build a deterministic model of insulinglucose dynamics in subjects with IDDM and evaluate individual parameterr of the dynamic5 with the goal to assess subjects' ability to process glucose, counterregulate and avoid SH, etc. Computer freeware for interactive simulation of insulin and BG B. P. KOVATCHEV et 01. 8 profiles, such as AIDA, has been developed on the basis of a simple insulin-glucose model (Lehmann, 1999). We reported previously a deterministic model of insulin-glucose-counter-regulation dynamics during controlled hyperinsulinemic clamp (Kovatchev er al., 1999) that demonstrated that NOSH subjects have more aggressive counterregulatory response, thus greater self-protection against SH. The second approach would be to observe subjects' metabolic system on a "macro-level," without a reference to specific underlying factors, by simply recording multiple BG readings and trying to establish patterns through stochastic modeling. The assumption behind this second approach is that SH and high glycohemoglobin are two extremes of BG irregularity, associated with IDDM and driven by behavioral and biological factors. Some of these factors contribute to future SH, while others are precursors to high glycosylated hemoglobin. The problem then is to develop statistical methods capable of extracting from SMBG information relevant to SH and glycosylated hemoglobin. Our first step in that direction was to derive and validate a symmetrization of the BG measurement scale, since it was our opinion that the asymmetry of the scale prevents the standard statistical procedures from adequate assessment of fluctuations in the low BG range. The reason for that is simply numerical-compared to hyperglycemia, the range of hypoglycemia is scveral times smaller and therefore most averaging procedures would be intrinsically biased. To correct that we suggested a logarithmic transformation based on widely accepted clinical assumptions. The general logarithmic form o f f (BG) can be derived from the classic Box-Cox power transformation (x"- ] ) / a , u > 0, widely used for correction of skewed data (Box and Cox, 1964) as follows: Let g(.x:a,b) = (xu I)/u - 6, where for right-skewed data (like BG levels) the parameter a < 1. By fitting the parameters of g(x; a,6) to satisfy the assumptions A1 and A2, we find that the parameter n should be very close to zero. On the other hand, lirn,, ,o(x-" - I)/a = ln(xj, which suggests that a skewness correction satisfying A1 and A2 should be of a logarithmic type. This being -- said, we will emphasize one more time that the transformation f ( B G )unlike the Box-Cox skewness correction, does not depend on a particular data set. Instead, its parameters are evaluated on the basis of accepted clinical assumptions. This makes it applicable to a variety of data sets without a parameter re-estimation. The transformation f (BG) makes the BG measurement scale symmetric around zero. An immediate statistical implication is that the distribution of most BG data sets that we examined becomes closer to normal. Thus, the assumptions of the parametric statistical tests will be better satisfied with transformed, rather than the original BG data. Clinically, the transforn~eddata indicate the quality of a subjects' glycemic control: a mean less than zero shows a tendency towards hypoglycemia during the measurements, while a mean above zero is associated with hyperglycemia. A large standard deviation implies poor glycemic control, a small standard deviation shows a tight range for the BG levels. This intuitive idea serves as a basis for the definition of the LBGI and HBGI - two risk statistics related to the individual glycemic control in the low and high BG range. The LBGI repeatedly proved to be the most powerful predictor of SH. By using the rates of risk change SDn and SUp we include a temporal component in our considerations. This new model improves the prediction of future SH episodes, accounting for 46% of the variance of future SH episodes - 6% up from our previous report (Kovatchev et d., 1998. Cox e t a / . , 1994). As we mentioned in the introduction, this result is substantially better than the prediction of SH by other models. Although we collected data about all symptomatic low BG episodes experienced by the subjects, we concentrated our predictive analyses on SH for two reasons: 1) SH is a clinically significant complication of IDDM that is identified by a clear objective criteria, while milder hypoglycemia is symptom perception-dependent, and 2) SH is traditionally difficult to predict. The HBGI is associated with patients' glycosylated hemoglobin. However, this association is no stronger than the association with HbAi, of RISK ANALYSIS OF BLOOD GLUCOSE DATA 9 data by calculating the numthe average BG, or (2.07 x [ a v e r . ~ ~ e as~ ~ ~transform ~ ~ ~ ] this ) bers f (xl),f (x2 ), . . . ,f (x,) and draw a cubic originally suggested by Svendsen et nl. (1982). With spline S(t) passing through the points ( t t ,f(xl)), our data, both these quantities had correlations of )), . . . , (t,, ,f (x,,)). Thus, the function S (t) is (t2,f (x2, 0.7 with HbAl,, i.e. displayed relationship similar a continuous function defined on the whole interval to the linear relationship of HBGI with HbAl,. The [ t l , t , ] and such that S(t,) =f(x,), for j = 1 , . . . , n . major advantage of using HBGI instead of simply We calculate the numbers the average BG is that its values are comparable to LBGI. In other words, we now have measures for sk = IO.S(k + t ~ ) *if S(k) < 0 and 0 otherwise; both low and high BG risk that are compatible, comparable and additive (the two indices are defined on non-intersecting sets of BG readings - below and above 6.25). In addition, the HBGI describes very thus getting interpolated values of rl(BG) at onewell the average BG - their relationship is almost hour increments. strictly linear (see Figure 3), and their correlation Next, consider all couples of numbers Sk with in these data was 0.98. The latter offers one more consecutive indices: CO= (so, SI ), CI = (sl, s2), C2 = confirmation of the fact that in calculations using ($2,s3), . . . and denote by MUpthe set of all couples the standard BG scale, such as taking the mean Ck, such that sk > s k + l and by Md,, the set of all BG, the hypoglycemic readings simply vanish due + ~ let SDn be couples Ck, such that sk < ~ k Finally, to the asymmetry of the scale. It also offers one the average of the numbers .yk+l - sk, provided that more explanation of the poor prediction of SH from Ck E Md,,, and SU17 be the average of the numbers average BG and HbA1,. sk+1 - sk, provided that Ck E MUp. Clinically, LBGI and HBGI offer an assessment In fact, the numbers SDn and S u p provide a of patients' glycemic control that covers both the measure for the rate of change of r(BG(t)) as BG risk for hypoglycemia and the risk for hyperfluctuates in the lower BG range. More precisely, glycemia. This assessment uses readily availSDn is a certain measure estimating the rate of able self-monitoring data and a simple computaincrease of vl(BG(t)) while BG goes down and tional procedure that can be incorporated in selfS u p is a measure estimating the rate of decrease monitoring devices, or in their downloading softof rl(BG(t)) while BG goes up. ware. However, further research is needed to establish clinically accurate target limits and lowhigh Acknowledgment risk zones for the LBGI and HBGI. Since LBGI and HBGI quantify observed BG fluctuations, their valThis study is supported by the National Institutes ues depend on a variety of biologic and behavioral of Health grant R 0 1 DK51562 and by a grant from factors such as awareness of hypoglycemia, treatLifescan Corp., Milpitas, CA. ment decisions and strategies, individual choices, etc. Consequently the control of LBGI and HBGI within target limits is possible through a variety of References means, including adjustments of regiment, awareness training, etc. Box. G. E. P. and Cox. D. R. (1964). An Analysis of Trans- APPENDIX: COMPUTATION OF BG RISK RATE OF CHANGE Let xl,x2,. . . .xn be rz BG readings of a subject's meter at time points t l , t2,. . . , t,,. We formations (with discussion), Journal o f t / ~ eRo,yal Strrtistir.al SocieQ. Series B (n~etl7odologicnl),26, 2 1 1-252. Cox, D. J., Kovatchev, B. P., Julian, D. M., Gonder-Frederick, L. A,. Polonsky, W. H., Schlundt, D. G. and Clarke, W. L. (1994). Frequency of severe hypoglycemia in IDDM can be predicted from self-monitoring blood glucose data. Journcil of Clinical Endocrinology and Metabolism. 79, 1659- 1662. Cryer. P. E. (1993). Hypoglycemia begets hypoglycemia. Diabetes, 42, 1691- 1693. 10 B. P. KOVATCHEV et a1 Cryer, P. E., Fisher. J. N. and Shamoon, H. (1994). Hypoglycemia. Diabete.~Care, 17, 734-755. DCCT Research Group. (1991). Epidemiology of aevere hypoglycemia in the diabetes control and complications trial. American Jourr~ulof Medicine, 90, 450-459. DCCT Research Group. (1993). The effect of intensive treatment of diabetes on the development and progression of long-term complications of insulin-dependent diabetes mellitus. New Engla~ldJournal of Medicine, 329, 978-986. DCCT Research Group. (1997). Hypoglycemia in the Diabetes Control and Complications Trial. Diabetes, 46, 27 1-286. Gold, A. E., Frier, B. M., MacLeod, K. M. and Deary, I. J. (1997). A structural equation model for predictors of severe hypoglycemia in patients with insulin-dependent diabetes mellitus. Diabetic Medicine, 14, 309-3 15. Kovatchev, B. P.,Cox, D. J.,Gonder-Frederick, L. A. and Clarke, W. L. (1997). Symmetrization of the blood glucose measurement scale and its applications. Diuberes Care, 20, 1655- 1658. Kovatchev, B. P., Cox, D. J., Gonder-Frederick, L. A,, YoungHyman. D., Schlundt, D. and Clarke, W. L. (1998). Assessment of Risk for Severe Hypoglycemia Among Adults with IDDM: Validation of the Low Blood Glucose Index. Diabetes Care, 21. 1870- 1875. Kovatchev, B. P., Farhy, L. S., Cox, D. J., Straume, M., Yankov, V. I., Gonder-Frederick, L. A. and Clarke, W. L. (1999). Modeling Insulin-Glucose Dynamics During Insulin Induced Hypoglycemia. Evaluation of Glucose Counterregulation. J of Tlzeowtical Medicine. 1, 3 13-323. Lehmann, E. D. (1999). Experience with the Internet Release of AIDA v4.0 - http:l/www.diabetic.urg.uWaida.htm - An Interactive Educational Diabetes Simulator. Diabetes Technology & Therapeutics, 1, 41 -54. Reichard, P. and Phil, M. (1994). Mortality and treatment side effects during long-term intensified conventional insulin treatment in the Stockholm Diabetes Intervention study. Diabetes, 43, 313-317. Santiago. J. V. (1993). Lessons from the Diabetes Control and Complications Tr~al.Diabetes. 42, 1549- 1554. Svendsen, P. A,, Lauritzen, T., Soegaard, U. and Nerup. J. (1982). Glycosylated hemoglobin and steady-state mean blood glucose concentration in Type I (Insulin-Dependent) diabetes. Diubetologia, 23, 403-405.
