Absolute Value Functions 2.6 Families of Functions.notebook September 29, 2011
advertisement
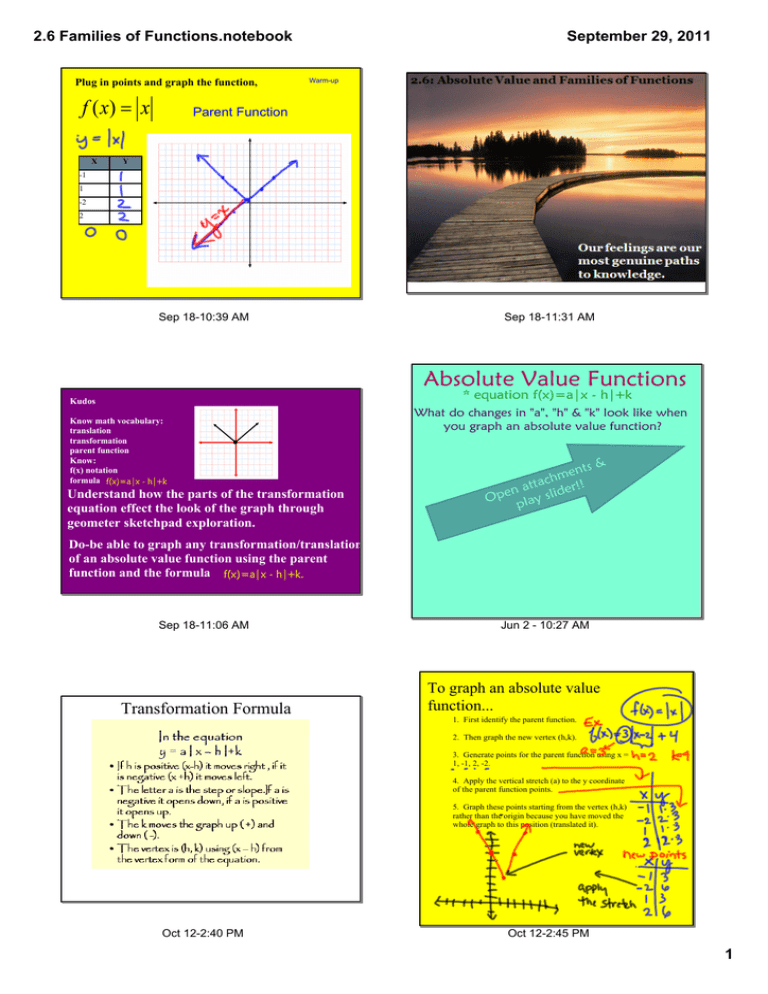
2.6 Families of Functions.notebook Plug in points and graph the function, September 29, 2011 Warm­up Parent Function X Y ­1 1 ­2 2 Sep 18­10:39 AM Sep 18­11:31 AM Absolute Value Functions * equation f(x)=a|x - h|+k Kudos Know math vocabulary: translation transformation parent function Know: f(x) notation formula f(x)=a|x - h|+k Understand how the parts of the transformation equation effect the look of the graph through geometer sketchpad exploration. What do changes in "a", "h" & "k" look like when you graph an absolute value function? ts & men h c ta ! n at der! Ope play sli Do­be able to graph any transformation/translation of an absolute value function using the parent function and the formula f(x)=a|x - h|+k. Sep 18­11:06 AM Transformation Formula Jun 2 ­ 10:27 AM To graph an absolute value function... 1. First identify the parent function. 2. Then graph the new vertex (h,k). 3. Generate points for the parent function using x = 1, ­1, 2, ­2. 4. Apply the vertical stretch (a) to the y coordinate of the parent function points. 5. Graph these points starting from the vertex (h,k) rather than the origin because you have moved the whole graph to this position (translated it). Oct 12­2:40 PM Oct 12­2:45 PM 1 2.6 Families of Functions.notebook September 29, 2011 Write an equation for each translation of Use f(x)=a|x - h|+k Sep 29­3:20 PM Sep 18­10:54 AM Graph these absolute value functions: More equations... 1. f(x)=|x+3|-2 2. f(x)=|x-1|+3 3. f(x)=-|x+1|+2 Answers are hiding!!! Sep 18­10:56 AM Graph these absolute value functions: 1. f(x)= 2|x - 4|-2 2. f(x)=3|x+2|- 4 3. f(x)=- 1/2|x - 1|+2 Jun 2 ­ 9:10 AM Now find the domain & range of these absolute value functions: 1. f(x)=|x+3|-2 Answers are hiding!!! Jun 2 ­ 9:10 AM D: R: 2. f(x)=|x-1|+3 D: R: 3. f(x)=-|x+1|+2 D: R: Jun 2 ­ 9:10 AM 2 2.6 Families of Functions.notebook September 29, 2011 u calc r you e in thes y r T Calculator use: Go to y= Press the math key. Arrow over to Num. Press enter for "abs" Type in formula when you get to left absolute value symbol use the above process. Enclose absolute value expression in ( ). Make sure stat plots are off. Hit graph Zoom. 1. f(x)= -|x - 4|-2 D: R: r. lato Now find the domain & range of these absolute value functions: 2. f(x)=3|x+2|- 4 D: R: 3. f(x)=- 1/2|x - 1|+2 D: R: Example: y=3abs(2x­7). Predict what it should look like­then graph. Sep 18­11:21 AM Jun 2 ­ 9:10 AM HW: 1­13 odd, 17­27 odd, 30­34 even, 35­ 37 all ANY QUESTIONS?? Sep 18­11:28 AM Jun 2 ­ 10:05 AM HW: 1­13 odd, 17­27 odd, 30­34 even, 35­37 all Jun 2 ­ 10:11 AM 3 Attachments Absolute Value slider.gsp
