Assignment: Retirement Name:
advertisement

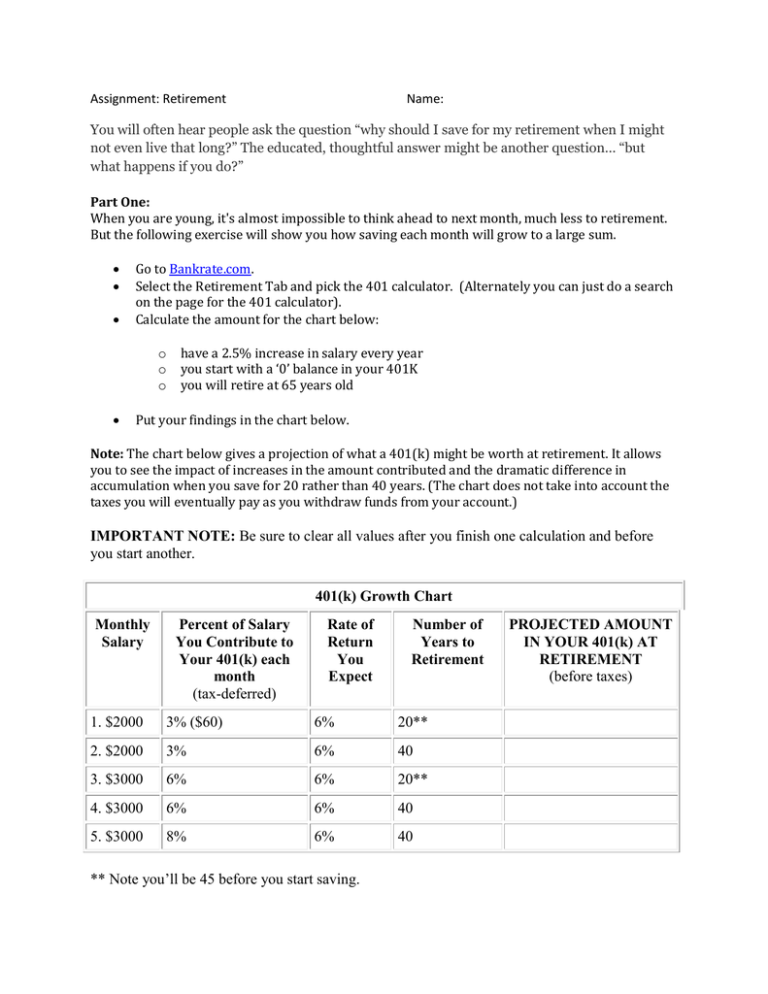
Assignment: Retirement Name: You will often hear people ask the question “why should I save for my retirement when I might not even live that long?” The educated, thoughtful answer might be another question… “but what happens if you do?” Part One: When you are young, it's almost impossible to think ahead to next month, much less to retirement. But the following exercise will show you how saving each month will grow to a large sum. Go to Bankrate.com. Select the Retirement Tab and pick the 401 calculator. (Alternately you can just do a search on the page for the 401 calculator). Calculate the amount for the chart below: o o o have a 2.5% increase in salary every year you start with a ‘0’ balance in your 401K you will retire at 65 years old Put your findings in the chart below. Note: The chart below gives a projection of what a 401(k) might be worth at retirement. It allows you to see the impact of increases in the amount contributed and the dramatic difference in accumulation when you save for 20 rather than 40 years. (The chart does not take into account the taxes you will eventually pay as you withdraw funds from your account.) IMPORTANT NOTE: Be sure to clear all values after you finish one calculation and before you start another. 401(k) Growth Chart Monthly Salary Percent of Salary You Contribute to Your 401(k) each month (tax-deferred) Rate of Return You Expect Number of Years to Retirement 1. $2000 3% ($60) 6% 20** 2. $2000 3% 6% 40 3. $3000 6% 6% 20** 4. $3000 6% 6% 40 5. $3000 8% 6% 40 ** Note you’ll be 45 before you start saving. PROJECTED AMOUNT IN YOUR 401(k) AT RETIREMENT (before taxes) 6. Which two scenarios give you the best returns? Explain your answer! 7. Which two scenarios give you the worst returns? Explain your answer! Part Two Planning for retirement early is important. But you also have to consider what happens when financial markets become unstable just before or just after you retire? How would that affect the return on your investment? Look at the Retirement Danger Zone chart below. Go to Money Chimp and enter the values for each. o Use – to calculate negative investment years. Calculate what would happen to the projected accumulation in your 401(k) account if financial markets fluctuate around the time you retire. For this simulation you’ll be assuming that the markets go up the first two years and down the second two years. Write your findings in the chart below. Retirement Danger Zone Chart Portfolio Value Five Years Before Retirement $85,000 First Year: Positive return 8% $91,800 Second Year: Positive return 6% $97,308 Third Year: Negative return 9% $88,550.28 Fourth Year: Positive return 2% $90,321.29 Fifth Year: Positive return 2% $93,934.14 9. $238,000 10. $955,000 Select 2 of the 3 questions below and write a 1 paragraph response to each. 11. In Part Two you assumed that the market dropped significantly just before your retirement. How do you think this would impact your retirement plans? 12. What can you do to make sure you have enough value in your financial assets during your final years of life? 13. What do you think you will need to learn and/or do to maximize your retirement income?


