2.6 - Absolute Value Transformations x y
advertisement
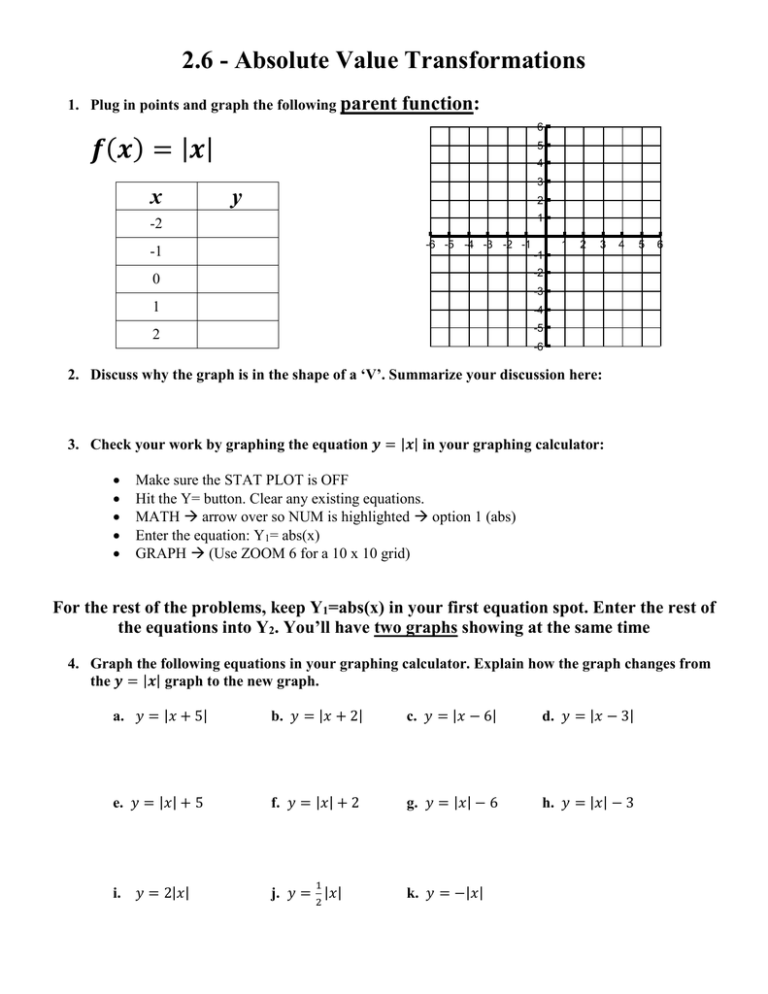
2.6 - Absolute Value Transformations 1. Plug in points and graph the following parent function: 6 𝒇(𝒙) = |𝒙| 5 4 3 x y 2 1 -2 -6 -5 -4 -3 -2 -1 -1 1 2 3 4 5 6 -1 -2 0 -3 1 -4 2 -5 -6 2. Discuss why the graph is in the shape of a ‘V’. Summarize your discussion here: 3. Check your work by graphing the equation 𝒚 = |𝒙| in your graphing calculator: Make sure the STAT PLOT is OFF Hit the Y= button. Clear any existing equations. MATH arrow over so NUM is highlighted option 1 (abs) Enter the equation: Y1= abs(x) GRAPH (Use ZOOM 6 for a 10 x 10 grid) For the rest of the problems, keep Y1=abs(x) in your first equation spot. Enter the rest of the equations into Y2. You’ll have two graphs showing at the same time 4. Graph the following equations in your graphing calculator. Explain how the graph changes from the 𝒚 = |𝒙| graph to the new graph. a. 𝑦 = |𝑥 + 5| b. 𝑦 = |𝑥 + 2| c. 𝑦 = |𝑥 − 6| d. 𝑦 = |𝑥 − 3| e. 𝑦 = |𝑥| + 5 f. 𝑦 = |𝑥| + 2 g. 𝑦 = |𝑥| − 6 h. 𝑦 = |𝑥| − 3 i. 𝑦 = 2|𝑥| j. 𝑦 = 2 |𝑥| 1 k. 𝑦 = −|𝑥| 5. Explain how each graph will differ from the graph of 𝒚 = |𝒙|. Check your answers by graphing 𝒚 = |𝒙| and the new equation into the graphing calculator. 2 a. 𝑦 = |𝑥 + 4| − 2 b. 𝑦 = |𝑥 − 3| + 6 c. 𝑦 = |𝑥 − 3| − 10 d. 𝑦 = 2|𝑥| + 4 e. 𝑦 = −3|𝑥 + 2| − 1 f. 𝑦 = 3 |𝑥| − 3 1

