6.1 – Finding Appropriate Models to Represent Data
advertisement
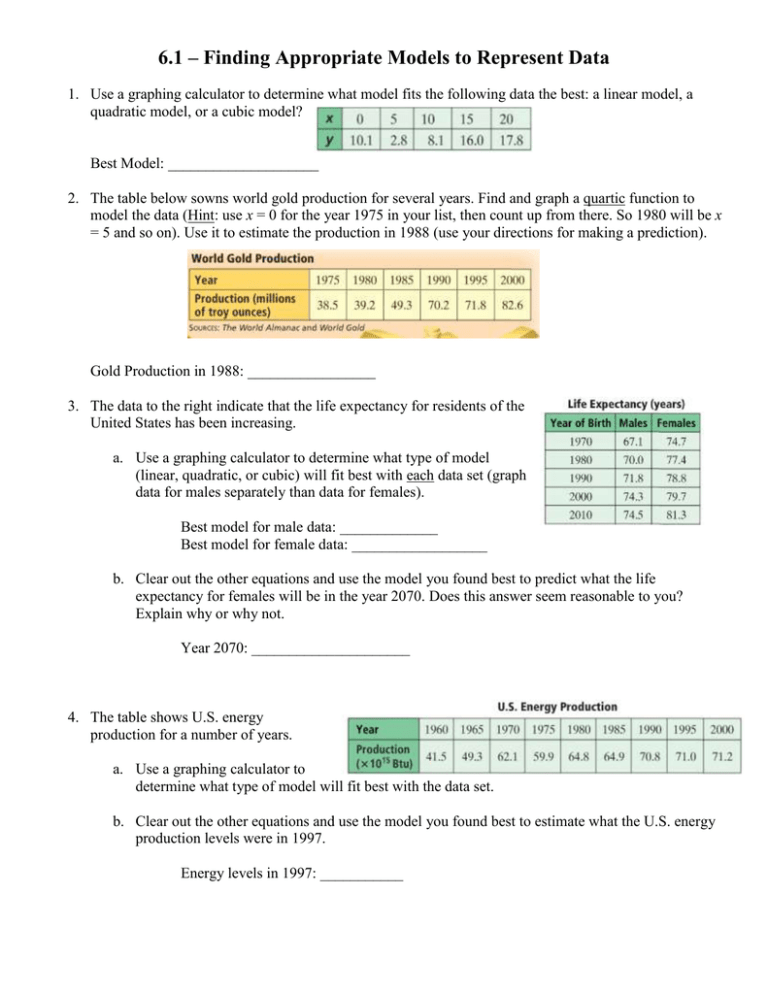
6.1 – Finding Appropriate Models to Represent Data 1. Use a graphing calculator to determine what model fits the following data the best: a linear model, a quadratic model, or a cubic model? Best Model: ____________________ 2. The table below sowns world gold production for several years. Find and graph a quartic function to model the data (Hint: use x = 0 for the year 1975 in your list, then count up from there. So 1980 will be x = 5 and so on). Use it to estimate the production in 1988 (use your directions for making a prediction). Gold Production in 1988: _________________ 3. The data to the right indicate that the life expectancy for residents of the United States has been increasing. a. Use a graphing calculator to determine what type of model (linear, quadratic, or cubic) will fit best with each data set (graph data for males separately than data for females). Best model for male data: _____________ Best model for female data: __________________ b. Clear out the other equations and use the model you found best to predict what the life expectancy for females will be in the year 2070. Does this answer seem reasonable to you? Explain why or why not. Year 2070: _____________________ 4. The table shows U.S. energy production for a number of years. a. Use a graphing calculator to determine what type of model will fit best with the data set. b. Clear out the other equations and use the model you found best to estimate what the U.S. energy production levels were in 1997. Energy levels in 1997: ___________

