Chapter 6 Part 2 Test Review
advertisement
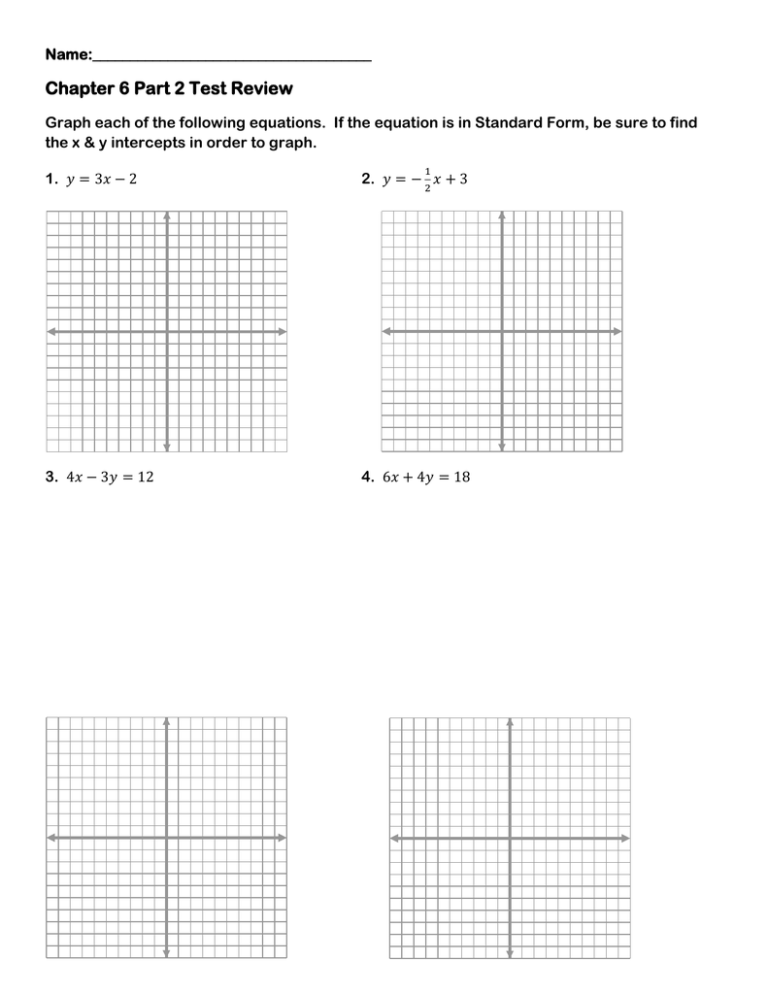
Name:_____________________________________ Chapter 6 Part 2 Test Review Graph each of the following equations. If the equation is in Standard Form, be sure to find the x & y intercepts in order to graph. 1 1. 𝑦 = 3𝑥 − 2 2. 𝑦 = − 2 𝑥 + 3 3. 4𝑥 − 3𝑦 = 12 4. 6𝑥 + 4𝑦 = 18 3 5. 𝑦 + 2 = −3(𝑥 − 1) 6. 𝑦 − 5 = 4 (𝑥 − 12) 7. 𝑥 = 3 8. 𝑦 = −7 For questions 9 – 12, write an equation for a line with the given information in slope-intercept form. 9. 𝑚 = 4; (2, 1) 4 10. 𝑚 = − 5 ; (−5, 1) 11. (−2, −2) 𝑎𝑛𝑑 (4, 10) 12. (1, −6) 𝑎𝑛𝑑 (−5, −4) For questions 13 – 16, determine whether the lines are parallel, perpendicular or neither. EXPLAIN. 1 13. 𝑦 = − 2 𝑥 + 5 2𝑥 + 4𝑦 = 9 15. 𝑥 + 4𝑦 = 8 8𝑥 − 2𝑦 = 20 14. 4𝑦 − 12𝑥 = 20 1 𝑦 = 3𝑥 + 1 16. 5𝑥 + 2𝑦 = 1 −4𝑦 − 10𝑥 = −2 17. Write an equation for a vertical line and an equation for a horizontal line that passes through the point (-4, 9). For questions 18 & 19, write an equation in point-slope form for a line that passes through the given point and is parallel to the given line. 18. 𝑦 = 3𝑥 − 10; (6, −5) 19. 6𝑥 + 9𝑦 = 18; (−1, 7) For questions 20 & 21, write an equation in point-slope form for a line that passes through the given point and is perpendicular to the given line. 2 20. 𝑦 = 3 𝑥 − 3; (9, 2) 21. 21𝑥 − 7𝑦 = 14; (3, 4) 22. Suppose your Advisory class is having a talent show to raise money for new music supplies. Your class estimates that 200 students and 150 adults will attend and that there will be $200 in expenses. Define your variables and write an equation to find out what ticket prices your class should set in order to raise $1000 (after you subtract out the expenses). 23. Use the table at the right to complete the following questions on graph paper. a. Create a scatter plot for the table. b. Draw a trend line for your data. c. Write an equation for your trend line. d. Use your equation from part (c) to predict the calories needed for a 16 year old male. e. Use your equation from part (c) to predict the age of a male who needs 2000 daily calories.
