6.1 – 6.3 Test
advertisement
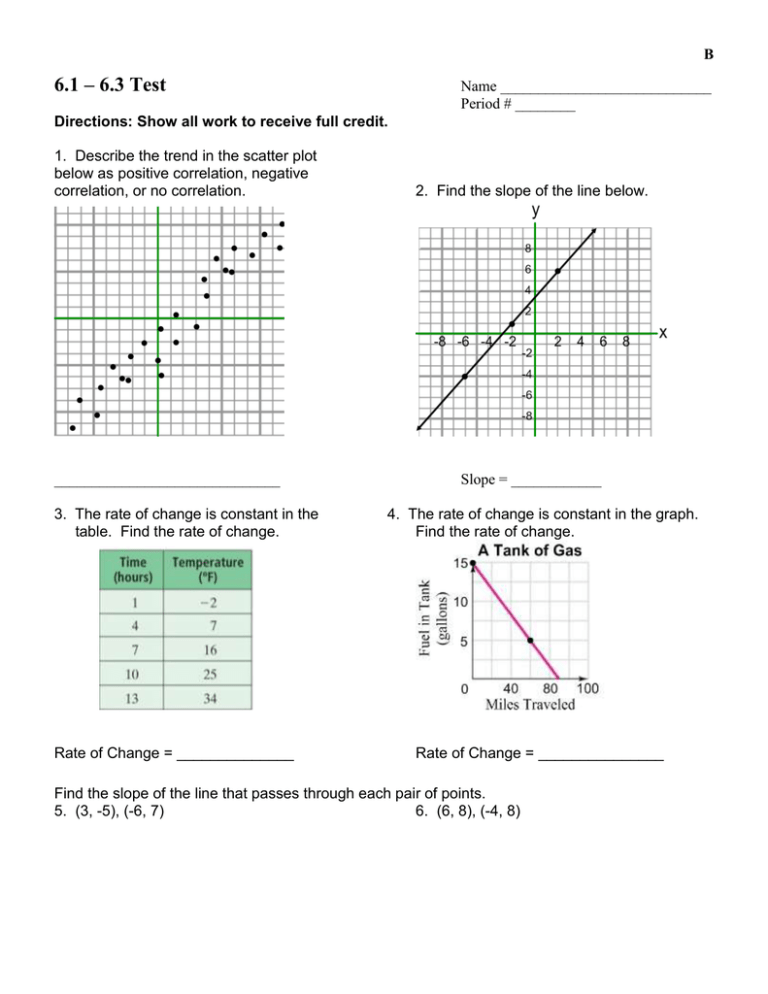
B 6.1 – 6.3 Test Name ____________________________ Period # ________ Directions: Show all work to receive full credit. 1. Describe the trend in the scatter plot below as positive correlation, negative correlation, or no correlation. ______________________________ 3. The rate of change is constant in the table. Find the rate of change. Rate of Change = ______________ 2. Find the slope of the line below. Slope = ____________ 4. The rate of change is constant in the graph. Find the rate of change. Rate of Change = _______________ Find the slope of the line that passes through each pair of points. 5. (3, -5), (-6, 7) 6. (6, 8), (-4, 8) B Find the slope and y-intercept of each equation. 2 7. y x 3 slope = _____________ 5 y-intercept = _________ 8. y + 3x = 6 slope = ___________ y-intercept = _____ For each equation express the slope of the line in two ways and then graph the equation. 2 x4 9. y 10. y 2 x 1 3 11. y 4 x 3 12. Write the equation of a line in slope intercept form with the given slope and y-intercept slope 5 2 y-intercept 3 2 B Write the slope-intercept form of the equation for each line. 13. 14. ______________________________ ______________________ 15. Does a vertical line have a slope that is Zero or Undefined? (Note: Vertical is up and down.) 16. A television production company charges a basic fee of $8,000 and then $3,500 per hour when filming a commercial. a.) Define the variables in the situation. x = _____________________ y = _____________________ b.) Write an equation in slope-intercept form relating the basic fee and per-charge. (Slopeintercept form is y mx b ). c.) If 4 hours of filming was needed what would be the total production cost for the commercial? B 17.The scatter plot below shows the number of CDs (in millions) that were sold from 1999 to 2005. Use the scatter plot to answer the following questions: A a) Describe what information point A gives you. b) Does the graph have positive, negative, or no correlation? c) Describe what the correlation means in context of the problem. d) Draw a line of best fit on the graph. If the trend continued, predict how many CDs were sold in the year 2006.

