What Lies Beneath T Controlling the root–knot nematode in eastern Arizona
advertisement

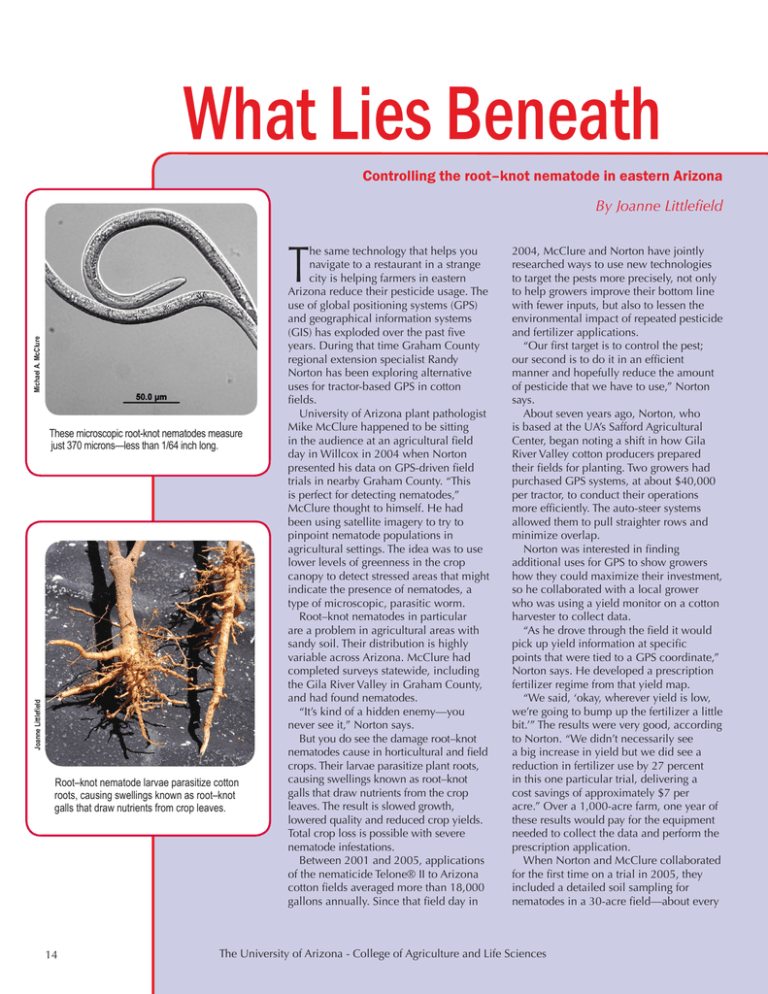
What Lies Beneath Controlling the root–knot nematode in eastern Arizona By Joanne Littlefield Michael A. McClure T Joanne Littlefield These microscopic root-knot nematodes measure just 370 microns—less than 1/64 inch long. Root–knot nematode larvae parasitize cotton roots, causing swellings known as root–knot galls that draw nutrients from crop leaves. 14 he same technology that helps you navigate to a restaurant in a strange city is helping farmers in eastern Arizona reduce their pesticide usage. The use of global positioning systems (GPS) and geographical information systems (GIS) has exploded over the past five years. During that time Graham County regional extension specialist Randy Norton has been exploring alternative uses for tractor-based GPS in cotton fields. University of Arizona plant pathologist Mike McClure happened to be sitting in the audience at an agricultural field day in Willcox in 2004 when Norton presented his data on GPS-driven field trials in nearby Graham County. “This is perfect for detecting nematodes,” McClure thought to himself. He had been using satellite imagery to try to pinpoint nematode populations in agricultural settings. The idea was to use lower levels of greenness in the crop canopy to detect stressed areas that might indicate the presence of nematodes, a type of microscopic, parasitic worm. Root–knot nematodes in particular are a problem in agricultural areas with sandy soil. Their distribution is highly variable across Arizona. McClure had completed surveys statewide, including the Gila River Valley in Graham County, and had found nematodes. “It’s kind of a hidden enemy—you never see it,” Norton says. But you do see the damage root–knot nematodes cause in horticultural and field crops. Their larvae parasitize plant roots, causing swellings known as root–knot galls that draw nutrients from the crop leaves. The result is slowed growth, lowered quality and reduced crop yields. Total crop loss is possible with severe nematode infestations. Between 2001 and 2005, applications of the nematicide Telone® II to Arizona cotton fields averaged more than 18,000 gallons annually. Since that field day in 2004, McClure and Norton have jointly researched ways to use new technologies to target the pests more precisely, not only to help growers improve their bottom line with fewer inputs, but also to lessen the environmental impact of repeated pesticide and fertilizer applications. “Our first target is to control the pest; our second is to do it in an efficient manner and hopefully reduce the amount of pesticide that we have to use,” Norton says. About seven years ago, Norton, who is based at the UA’s Safford Agricultural Center, began noting a shift in how Gila River Valley cotton producers prepared their fields for planting. Two growers had purchased GPS systems, at about $40,000 per tractor, to conduct their operations more efficiently. The auto-steer systems allowed them to pull straighter rows and minimize overlap. Norton was interested in finding additional uses for GPS to show growers how they could maximize their investment, so he collaborated with a local grower who was using a yield monitor on a cotton harvester to collect data. “As he drove through the field it would pick up yield information at specific points that were tied to a GPS coordinate,” Norton says. He developed a prescription fertilizer regime from that yield map. “We said, ‘okay, wherever yield is low, we’re going to bump up the fertilizer a little bit.’” The results were very good, according to Norton. “We didn’t necessarily see a big increase in yield but we did see a reduction in fertilizer use by 27 percent in this one particular trial, delivering a cost savings of approximately $7 per acre.” Over a 1,000-acre farm, one year of these results would pay for the equipment needed to collect the data and perform the prescription application. When Norton and McClure collaborated for the first time on a trial in 2005, they included a detailed soil sampling for nematodes in a 30-acre field—about every The The University University of of Arizona Arizona -- College College of of Agriculture Agriculture and and Life Life Sciences Sciences Using GPS to Target Nematicide Applications for Root–Knot Nematodes and soil texture, and from that data you can build a soil texture map,” says Norton. “We now know where the fine texture is, and where the sands are.” It’s been well documented that nematodes live in the sandy areas of the field, not in the clay areas. “They just don’t survive in the finetextured soils,” Norton explains. “Thus we have acreage where we’ve applied nematicide per the map, and we have areas where we’ve just applied it in strips all the way through the field.” The more intricate design will allow the researchers to determine more precisely if their yield response is a result of the nematicide application or some other factor. Still, growers in Graham County aren’t jumping to add another input to their production regime, and Norton believes he still needs to prove to them that their crops are actually being damaged by nematodes. His clientele are competing in a far more global economy today, with markets influenced by countries with relatively inexpensive input costs, while the costs of inputs for U.S. producers continue to rise. “It’s still kind of a ‘wait and see,’” Norton says. “We’ve had some excellent yields in this valley, some of the highest yields in the state. But if we can show that growers can target certain areas of the field through GPS and control the pest efficiently, they are more likely to consider using the nematicide.” Using the latest tools to improve yields while reducing the cost of chemical pesticides benefits both the grower’s bottom line and the environment, according to Norton. “This is the type of thing that’s going to keep agriculture viable in Arizona.” Figure 1. Figure 2. Randy Norton 2500 square feet—resulting in 500 soil samples. Next, armed with yield maps, the satellite imagery McClure had been monitoring and the soil sample data, the two researchers began constructing the case for spot use of a nematicide, rather than blanket applications. “We knew we had nematodes in certain sections of the field and if we could correlate the drop in yield to nematode pressure, we could use that yield map to develop a prescription application map for the nematicide,” says Norton. “We put that map in the tractor’s computer and drove through a test plot of about 19 acres, and the injector would apply the chemical wherever we had programmed it to turn on and off.” Only a little more than 8 acres actually were determined to need treatment. “We knew there were some areas in the field where the decrease in yield wasn’t due to nematodes,” Norton admits. The small size of the test plot didn’t allow the researchers to take into account variations in yield other than nematodes. For example, water often accumulates at the tail-end of a field, leading to reduced cotton growth. Norton and McClure repeated the trial in a larger field in 2006, with better results: a 56 percent reduction in Telone® II applications. “We know we were controlling the nematodes and we also know we were doing it in a targeted way that was effective,” Norton says. The UA results show that a single application of five gallons per acre will control root–knot nematodes for the entire growing season. With Telone® II currently costing about $11 per gallon, the input per acre would amount to $55 for the nematicide, but spot-treated areas would cost less. For example, if just 42 percent of an acre needed treatment, the input cost for the nematicide would fall to $23. The 2007 growing season found the research team adding another technology to the mix: an electromagnetic probe called EM-38. Norton and McClure used it in Safford in eastern Arizona, and in Coolidge in central Arizona. “Depending on how you use the machine, you can measure salt content Figure 3. Figure 1. Yield map of cotton test field in 2005. Green areas had the highest yields, red areas the lowest, possibly due to nematode damage. Figure 2. Prescription map of same field showing the nematicide “as applied” (blue) to an 18.5 acre rectangle of the test field in 2006. Contact Randy Norton (928) 428-2432 rnorton@cals.arizona.edu Michael McClure (520) 621-7161 mcclure@ag.arizona.edu 2007 2007 Agricultural Agricultural Experiment Experiment Station Station Research Research Report Report Figure 3. Yield map from the 2006 harvest after prescription application of TeloneR II. The rectangle marks the 18.5 acres of the prescriptiontreated area. Green areas had the highest yields, red areas the lowest. Cotton yields increased in the application area. 15


