Box D: Underlying Inflation
advertisement
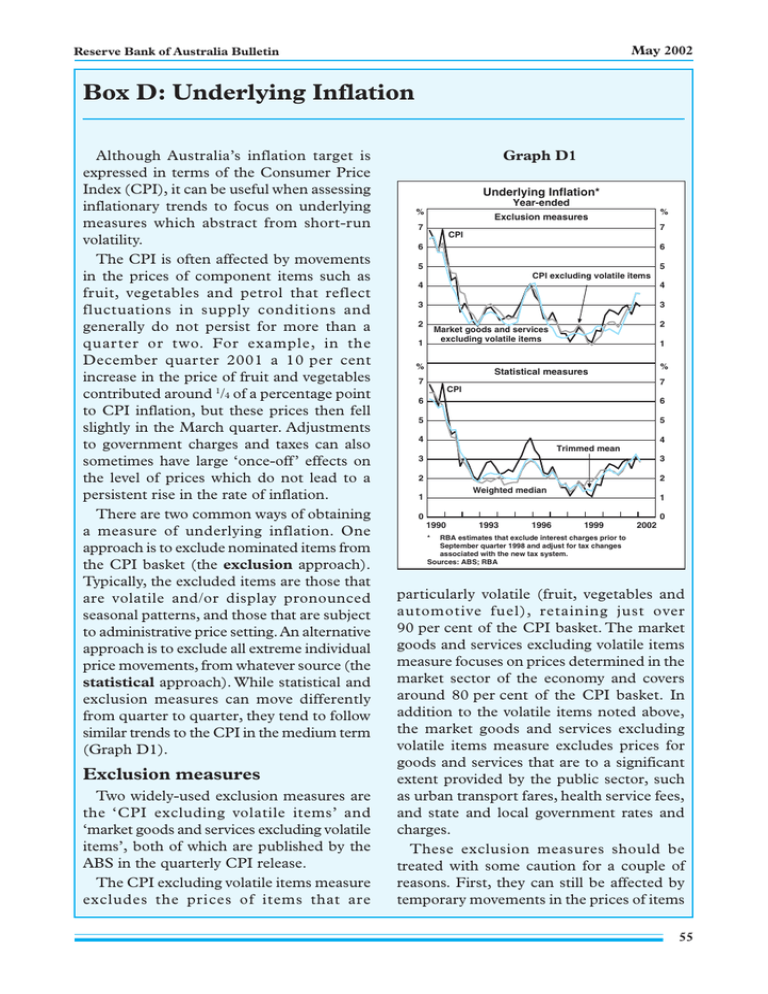
May 2002 Reserve Bank of Australia Bulletin Box D: Underlying Inflation Although Australia’s inflation target is expressed in terms of the Consumer Price Index (CPI), it can be useful when assessing inflationary trends to focus on underlying measures which abstract from short-run volatility. The CPI is often affected by movements in the prices of component items such as fruit, vegetables and petrol that reflect fluctuations in supply conditions and generally do not persist for more than a quarter or two. For example, in the December quarter 2001 a 10 per cent increase in the price of fruit and vegetables contributed around 1/4 of a percentage point to CPI inflation, but these prices then fell slightly in the March quarter. Adjustments to government charges and taxes can also sometimes have large ‘once-off’ effects on the level of prices which do not lead to a persistent rise in the rate of inflation. There are two common ways of obtaining a measure of underlying inflation. One approach is to exclude nominated items from the CPI basket (the exclusion approach). Typically, the excluded items are those that are volatile and/or display pronounced seasonal patterns, and those that are subject to administrative price setting. An alternative approach is to exclude all extreme individual price movements, from whatever source (the statistical approach). While statistical and exclusion measures can move differently from quarter to quarter, they tend to follow similar trends to the CPI in the medium term (Graph D1). Exclusion measures Two widely-used exclusion measures are the ‘CPI excluding volatile items’ and ‘market goods and services excluding volatile items’, both of which are published by the ABS in the quarterly CPI release. The CPI excluding volatile items measure excludes the prices of items that are Graph D1 Underlying Inflation* Year-ended % % Exclusion measures 7 7 CPI 6 6 5 5 CPI excluding volatile items 4 4 3 3 2 2 Market goods and services excluding volatile items 1 % 1 % Statistical measures 7 7 CPI 6 6 5 5 4 4 Trimmed mean 3 3 2 2 Weighted median 1 1 0 0 1990 1993 1996 1999 2002 * RBA estimates that exclude interest charges prior to September quarter 1998 and adjust for tax changes associated with the new tax system. Sources: ABS; RBA particularly volatile (fruit, vegetables and automotive fuel), retaining just over 90 per cent of the CPI basket. The market goods and services excluding volatile items measure focuses on prices determined in the market sector of the economy and covers around 80 per cent of the CPI basket. In addition to the volatile items noted above, the market goods and services excluding volatile items measure excludes prices for goods and services that are to a significant extent provided by the public sector, such as urban transport fares, health service fees, and state and local government rates and charges. These exclusion measures should be treated with some caution for a couple of reasons. First, they can still be affected by temporary movements in the prices of items 55 May 2002 Statement on Monetary Policy that are not excluded. For example, over the past year the rise in the prices of overseas travel and meat has been unusually large by historical standards, boosting these measures by around 1/2 per cent. Second, the decision about which components to remove is somewhat arbitrary. By excluding specific components all the time, all information contained in those components – including that reflecting genuine underlying forces – is lost. Statistical measures In recent years there has been considerable research into statistical measures of underlying inflation. Two such measures calculated by the Bank are the ‘trimmed mean’ and the ‘weighted median’. 1 In contrast to exclusion measures, statistical measures utilise all components of the CPI in their calculation. Each quarter, the CPI components, and their weights in the CPI, are ranked by the size of their price movement in the quarter. The trimmed mean is calculated as the weighted mean of the central 70 per cent of the quarterly price change distribution of all CPI components; that is, the top and bottom 15 per cent of the distribution are trimmed. In practice many of the ‘volatile’ items removed from the exclusion measures considered above will often be excluded from this measure too. However, the trimmed mean excludes extreme movements in any item, while small movements in usually volatile items will remain in the calculation. The weighted median is the inflation rate for that item which is in the middle of the total distribution of price changes; that is, it trims away all but the midpoint of the distribution so that half the component weights are on one side of the median, and half on the other. Statistical measures also have their shortcomings. One of the most important is that they are harder to interpret than exclusion measures. It is not always clear what information is being preserved and what is being excluded in a statistical measure, whereas this is unambiguous in the case of an exclusion measure. Conclusion Although the Bank targets CPI inflation, quarter-to-quarter volatility in the series (in particular ‘once-off ’ price movements in specific components) means that it is useful to look at measures of the underlying trend in inflation. There is, however, no single, unambiguously precise measure of underlying inflation. In practice, the Bank’s approach is to monitor a variety of measures and, while remaining aware of their individual strengths and weaknesses, take all of these into account when trying to gauge the underlying trend in consumer prices. Currently, the Bank’s judgement is that underlying inflation is around the same as CPI inflation at just under 3 per cent. R 1. Both are reported on the Bank’s website at http://www.rba.gov.au/Statistics/measures_of_cpi.html and are listed shortly after the release of the CPI each quarter. For more information about the properties of statistical underlying inflation measures, see Kearns (1998), ‘The Distribution and Measurement of Inflation’, Reserve Bank of Australia Research Discussion Paper No 9810 (available at http://www.rba.gov.au/ PublicationsAndResearch/RDP/RDP9810.html). 56

