Import Prices and Inflation 1
advertisement
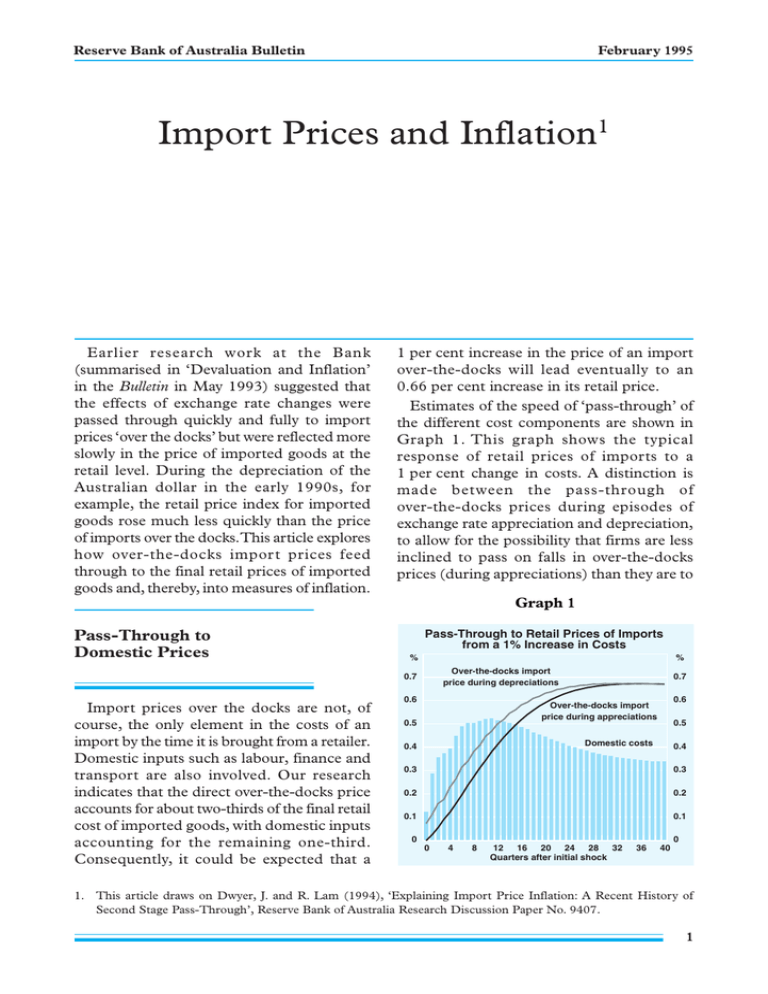
Reserve Bank of Australia Bulletin February 1995 Import Prices and Inflation1 Earlier research work at the Bank (summarised in ‘Devaluation and Inflation’ in the Bulletin in May 1993) suggested that the effects of exchange rate changes were passed through quickly and fully to import prices ‘over the docks’ but were reflected more slowly in the price of imported goods at the retail level. During the depreciation of the Australian dollar in the early 1990s, for example, the retail price index for imported goods rose much less quickly than the price of imports over the docks. This article explores how over-the-docks import prices feed through to the final retail prices of imported goods and, thereby, into measures of inflation. 1 per cent increase in the price of an import over-the-docks will lead eventually to an 0.66 per cent increase in its retail price. Estimates of the speed of ‘pass-through’ of the different cost components are shown in Graph 1. This graph shows the typical response of retail prices of imports to a 1 per cent change in costs. A distinction is made between the pass-through of over-the-docks prices during episodes of exchange rate appreciation and depreciation, to allow for the possibility that firms are less inclined to pass on falls in over-the-docks prices (during appreciations) than they are to Graph 1 Pass-Through to Domestic Prices Pass-Through to Retail Prices of Imports from a 1% Increase in Costs % % Over-the-docks import price during depreciations 0.7 Import prices over the docks are not, of course, the only element in the costs of an import by the time it is brought from a retailer. Domestic inputs such as labour, finance and transport are also involved. Our research indicates that the direct over-the-docks price accounts for about two-thirds of the final retail cost of imported goods, with domestic inputs accounting for the remaining one-third. Consequently, it could be expected that a 0.6 0.7 0.6 Over-the-docks import price during appreciations 0.5 0.5 Domestic costs 0.4 0.4 0.3 0.3 0.2 0.2 0.1 0.1 0 0 0 4 8 12 16 20 24 28 32 Quarters after initial shock 36 40 1. This article draws on Dwyer, J. and R. Lam (1994), ‘Explaining Import Price Inflation: A Recent History of Second Stage Pass-Through’, Reserve Bank of Australia Research Discussion Paper No. 9407. 1 February 1995 Import Prices and Inflation pass on increases (during depreciations). The estimates suggest that the pass-through of changes in the over-the-docks price is very slow; when the currency depreciates, it takes two years before half of the possible passthrough is realised. Pass-through is even slower when the currency appreciates. Pass-through of changes in domestic costs is shown to be much quicker, in part because increases in domestic costs tend to be regarded as permanent. Changes in over-the-docks import prices, on the other hand, might often be seen as temporary, especially where they are driven by exchange rate movements which can be reversible over relatively short periods of time. When changes in the cost of imports and domestic inputs are not passed on immediately, this implies a change in the distributors’ mark-up. Although data on actual variations in mark-ups are not available, retail prices of imports and domestic costs can be used to calculate an implied mark-up. The Implied Mark-up The mark-up can be defined as the ratio of the retail import price to total unit costs, where total unit costs are a weighted average of the over-the-docks import price and the index of domestic costs. (The shares of these items in total unit costs are used as weights.) An index of this mark-up of price over costs is shown in Graph 2. It is compared with an index of a trade-weighted exchange rate.2 The implied mark-up is subject to sizeable fluctuations, some of which last for a long time. Fluctuations in the mark-up occurred around a modest trend decline until the September quarter 1986, after which there was a sharp increase in the mark-up, reaching a record high by late 1988. (Widespread Graph 2 The Mark-up and the Exchange Rate % % Sep 86 Mar 88 Sep 87 Mar-89 120 120 Mark-up on consumer imports 100 100 80 80 Consumption import weighted TWI 60 60 40 73/74 78/79 83/84 88/89 40 93/94 perceptions at this time of a disproportionate rise in importers’ mark-ups resulted in an inquiry by the Prices Surveillance Authority in 1989.3) The implied mark-up has since drifted down, but remains at a level above that for most of the period shown. Retailers could be expected to seek to increase their margins during times of appreciation, and decrease them during times of depreciation to help retain the market for their product. Graph 2, however, suggests that during the large depreciation in 1985 and 1986, apparent mark-ups fell by significantly less than the exchange rate. In the following period of appreciation, the mark-up rose by more than the exchange rate.The appreciations (from September 1986 to September 1987 and from March 1988 to March 1989) operated to lower costs but retailers appear to have taken the opportunity to increase their mark-ups. It can be argued that, given downward stickiness in final retail prices, in the short run, increases in mark-ups during appreciations are greater than falls during depreciations. (This view derives some suppor t from the asymmetrical responses shown in Graph 1.) Another view is that the strong domestic 2. Weights are proportional to shares of consumption imports from our trading partners. 3. Prices Surveillance Authority (1989), ‘Inquiry Into the Effects of Exchange Rate Appreciation on Prices of Consumer Goods’, Report No. 21, Canberra, AGPS. 2 Reserve Bank of Australia Bulletin February 1995 Graph 3 Retail Price and Total Unit Costs for Imported Consumer Goods Index 160 Index Import price index for consumption goods 170 170 Mar-89 Mar-88 Sep-86 Sep-87 160 150 150 140 140 Total costs 130 130 120 120 Imported component for the CPI 110 110 100 100 90 90 1986 1988 1990 1992 1994 demand of the late 1980s created an opportunity for firms to increase their markup with little fear of losing customers. Are we likely to see a re-run of this situation in the late 1980s such that mark-ups rise, thereby diminishing the anti-inflationary benefit of any exchange rate appreciation? Several important differences exist between the present environment and that of the late 1980s. The first is the current level of apparent mark-ups, which is higher now than in the mid 1980s when importers, emerging from the depreciation of this time, had a clear incentive to seek to recover lost margins. The second difference stems from microeconomic reform and the increased focus on competition of recent years. We can expect that, in a more competitive market, importers will be more inclined to preserve market share by reducing margins and domestic costs, than they will be to raise final prices. These and other factors mean that the effects of exchange rate changes are likely to be reflected in variations in mark-ups as well as in final prices. 3


