NOTES FOR TALK TO BUSINESS ... OF AUSTRALIA ANNUAL DINNER
NOTES FOR TALK TO BUSINESS COUNCIL
OF AUSTRALIA ANNUAL DINNER
MELBOURNE – 8 JULY 2003
I would like to start by thanking the Business Council of Australia for inviting me to its
Annual Dinner. This is the first such occasion I have attended, and I note that the price of my invitation is that I have to give the after-dinner speech. Given the time of day, you will be pleased to hear that I will confine myself to a few simple observations, rather than delivering an economic treatise.
Some people may be expecting a commentary on the current outlook for monetary policy, but I am afraid they will be disappointed. Last week we made a decision on monetary policy at our July Board Meeting, and it received a lot of press coverage. Not everyone agreed with the decision, but I have to say that I was quite impressed with the quality of the discussion it generated. I think there is a very well informed and reasoned appreciation of the conflicting pressures and trade-offs we at the Reserve Bank face. Given that, I am reluctant to add any more at this stage, because, no matter how carefully modulated my comments, I would run a great risk of destabilising a basically stable situation.
Instead, I would like to move into my talk by starting with the observation that the
Australian economy has now gained international recognition for its stability, whereas in previous decades it was noted more for its booms and busts. In the jargon of financial markets, investing in Australia is now a “stability” or “safe haven” play whereas formerly it was known as a “cyclical” play. The latter term meant that the Australian economy did better than the world economy when the world economy was doing well, and worse when it was doing badly.
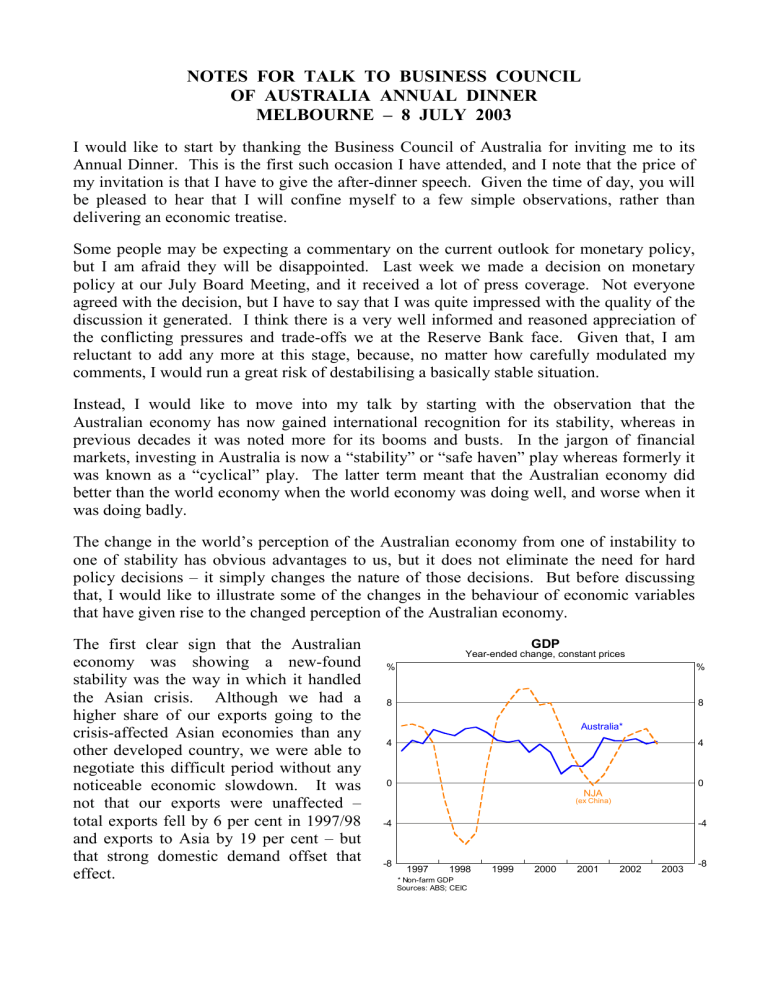
The change in the world’s perception of the Australian economy from one of instability to one of stability has obvious advantages to us, but it does not eliminate the need for hard policy decisions – it simply changes the nature of those decisions. But before discussing that, I would like to illustrate some of the changes in the behaviour of economic variables that have given rise to the changed perception of the Australian economy.
The first clear sign that the Australian economy was showing a new-found stability was the way in which it handled the Asian crisis. Although we had a higher share of our exports going to the crisis-affected Asian economies than any other developed country, we were able to negotiate this difficult period without any noticeable economic slowdown. It was not that our exports were unaffected – total exports fell by 6 per cent in 1997/98 and exports to Asia by 19 per cent – but that strong domestic demand offset that effect.
%
8
4
0
-4
-8
1997 1998
* Non-farm GDP
Sources: ABS; CEIC
GDP
Year-ended change, constant prices
1999 2000
Australia*
NJA
(ex China)
2001 2002
%
8
4
0
-4
2003
-8
2.
The second episode where Australia’s relative stability showed up was during the recent recession that occurred among the major economies in 2001. Over the course of that year, the G7 economies showed zero growth whereas we grew by about 4
%
6
4
GDP
Year-ended change, constant prices
Australia* per cent. Another interesting feature of that period was the divergent pattern between the Australian and
US economies. It used to be common to remark on the close link between
2
0
US* growth in the Australian and US economies, but that pattern broke down during the recent US recession.
-2
Note that we did have a slowdown in the second half of 2000, but that was a once-off effect caused by a fall in Index house-building following the introduction of the GST.
200
1997 1998 1999 2000
* Non-farm GDP
Sources: ABS; Thomson Financial Datastream
2001
Share Price Indices
January 1997=100
Europe
2002
US Turning to financial variables, the one we are most frequently made aware of is equity prices. Again, Australia stands out for relative stability. If we compare the behaviour of the ASX
200 with its equivalents in the US,
UK and Europe, the contrast is very striking. The boom and bust behaviour of the other three indices is hardly apparent at all in our stock prices, and over the whole six-and-ahalf year period since the start of
1997, our stock market has risen as much from end-point to end-point as any of them.
150
100
50
1997 1998 1999
Sources: Bloomberg; Datastream
%
Australia
2000 2001
Business Fixed Investment
Share of GDP, constant prices
US
UK
2002
13
Two real economic variables that are closely related to my previous graph are business fixed investment and the profit share of GDP. For simplicity, I have only compared the Australian experience to that of the US. On business fixed investment, again we have experienced none of the boom and bust that was apparent in the US.
11
9
1997 1998 1999 2000
Sources: ABS; Thomson Financial Datastream
2001 2002
2003
Australia
2003
2003
%
6
4
2
0
-2
Index
200
150
100
50
%
13
11
9
3.
In fact, our business fixed investment remained remarkably subdued during the period of booming stock markets, but has picked up over the last 18 months or so, when it has been most useful for us in a counter-cyclical sense.
The comparison for profits is very similar. Corporate profits in
Australia have risen relatively smoothly over the past decade, while in the US they rose until about the end of 1997, but have fallen thereafter. The interesting thing to notice about the US was that profits were falling through the boom years on the stock market of
1998 and 1999.
Index
140
120
100
80
Real Corporate Profits*
September 1994 = 100
Australia
US
Index
140
120
100
80
60 60
I think I have shown enough to get my story across, so I will not labour the point by showing any
40
1993 1995 1997
* Net of depreciation and interest
Sources: ABS; Bureau of Economic Analysis
1999 2001 2003
40 more comparisons. Instead, I will try to answer the questions of why our recent outcomes have been more stable than in the past, and why they have been more stable than most comparable countries.
The first of these questions is why has the Australian economy recently been more stable than it formerly was? My answer to this is that it is largely the result of policy reforms, but luck also played a part, which I will refer to later. On economic policy, I would point to a number of major reforms over the past 20 years that have been crucial:
· The floating of the exchange rate.
· The non-inflationary financing of budget deficits through the tender of government debt.
· The move of monetary policy to one based on an independent central bank and inflationtargeting regime.
· The move towards a more disciplined fiscal policy.
· Labour market deregulation. The main change here was to decentralise, i.e. to move away from a system based on a National Wage Case which awarded every worker a given percentage rise once a year (or, in earlier times, once a quarter). The labour force looks a lot different today, with a considerably smaller proportion working for the government, and a smaller proportion unionised.
· The opening up of the economy to international influences, both through the reduction in tariffs and the abolition of controls on capital movements.
· Competition policy applied both to the private sector and the government sector, and significant privatisation of the latter.
4.
These changes have generally moved the economy away from centralisation to decentralisation and away from regulation towards deregulation. They have resulted in a myriad of small changes occurring almost continually, rather than a few large ones. So the economy shows more day-to-day volatility but is less likely to build up the pressure that results in crises and large disruptive adjustments.
There is another reason why the performance of the Australian economy has become more stable than formerly which is not the result of deliberate policy decisions. I refer to the changed behaviour of our terms of trade, a subject I have spoken of on many previous occasions. The terms of trade is the ratio of the price of our exports to the price of our imports, that is the “buying power” of our exports. For much of the 20th century our terms of trade trended downwards because the prices of commodities, which make up much of our exports, failed to keep up with the prices of manufactures, which make up most of our imports. In my view, this trend started to change about 15 years ago, as new sources of low-cost manufactures started to come on stream from Asia, particularly from China. Now it is manufactures prices that act like
Index
105
“commodity” prices, and not just in a trend sense, but cyclically too.
You will note from my next graph that in the recent major-country recession of 2001, our terms of
100
95
90 trade actually improved.
Normally, we would have expected
85
1982 them to fall, which would have magnified the contractionary effect of the global slowdown.
1985
Source: ABS
1988
Terms of Trade
March 1982 = 100
1991 1994 1997 2000
Index
105
100
95
90
2003
85
The second question is why has the Australian economy recently shown much more stable behaviour than the much larger and more diversified US economy? This is not what you would normally expect of the two economies on the basis of their size or their history.
I think the major reason for this is that the US had an asset price boom and bust – commonly known as a bubble – and we did not. I have already shown the rise then fall in equity prices, profits and business investment in the US and the effect this has had on economic activity. The US economy is suffering from a hangover after the binge; we did not have the binge and so have avoided the hangover.
I would like to say that it was excellent economic policy that prevented us from participating in the binge, but that would be claiming too much. No-one really understands the relationship between macro-economic policy and asset price booms and busts well enough to make that claim. The unfortunate fact is that it seems to be possible to experience an asset price boom in an economy where macro-economic policy settings seem to be relatively well disciplined and inflation quite restrained.
5.
One thing we do know, however, both from the US experience and the earlier Japanese experience, is that once the asset price boom has turned into a bust, the effect on the macroeconomic policy settings is profound. Partly this is because the contracting economy affects the policy settings, and partly it is because policy-makers are quick to adjust their levers in an attempt to head off the contraction.
National Budget Balance
Per cent of GDP Again, a comparison with the US makes the point. On fiscal policy, the
% %
US
Australian budgetary position has varied little over recent years, with predominantly small surpluses being the
2
0 order of the day. In contrast, the US budgetary position has moved from a
Australia
2
0 surplus of 2 per cent of GDP in 2000 to an expected deficit of 4 per cent of GDP in 2003. The US has used a huge amount of its fiscal ammunition, while we have not even started to do so.
-2
-4
-6
1997 1998 1999 2000 2001 2002 2003
-2
-4
-6
Sources: Commonwealth Treasury; Thomson Financial Datastream On monetary policy, the contrast between the two countries is equally pronounced. The US put interest rates up slightly more than we did in
1999/2000, but the difference was minor. However, since the US recession hit in 2001, they have reduced their interest rates much more than us. From a peak in the second half of 2000, they percentage points, while we have come down in net terms by 1½ percentage points. I do not want to give the impression that I think stability of interest rates is a goal in its own right – only that it reflects the greater stability of the Australian economy.
%
6
5
4
3
2
1
0
Official Short-term Interest Rates
1997 1998 1999 2000
Sources: Federal Reserve Bank of New York; RBA
Australia
2001
US
2002 2003
%
6
5
4
3
2
1
0
Again, the contrast in both of the above policy variables between the two countries is as great as the contrast in the other variables I showed earlier, with Australia again representing stability and the US instability. Equally importantly, stability was not pushed at the price of lower growth: to the contrary, the Australian economy has grown faster than the US, not just over the past few years, but over the past decade. This, of course, has been the main point of my presentation this evening. The other point, I hope that has come out, is that the really large examples of instability in recent decades have emanated from a species of financial event – namely, an asset price boom and bust – rather than from the normal cyclical fluctuations we are all familiar with under the heading of the business cycle.
************

