The Labour Market, Structural Change and Recent Economic Developments
advertisement
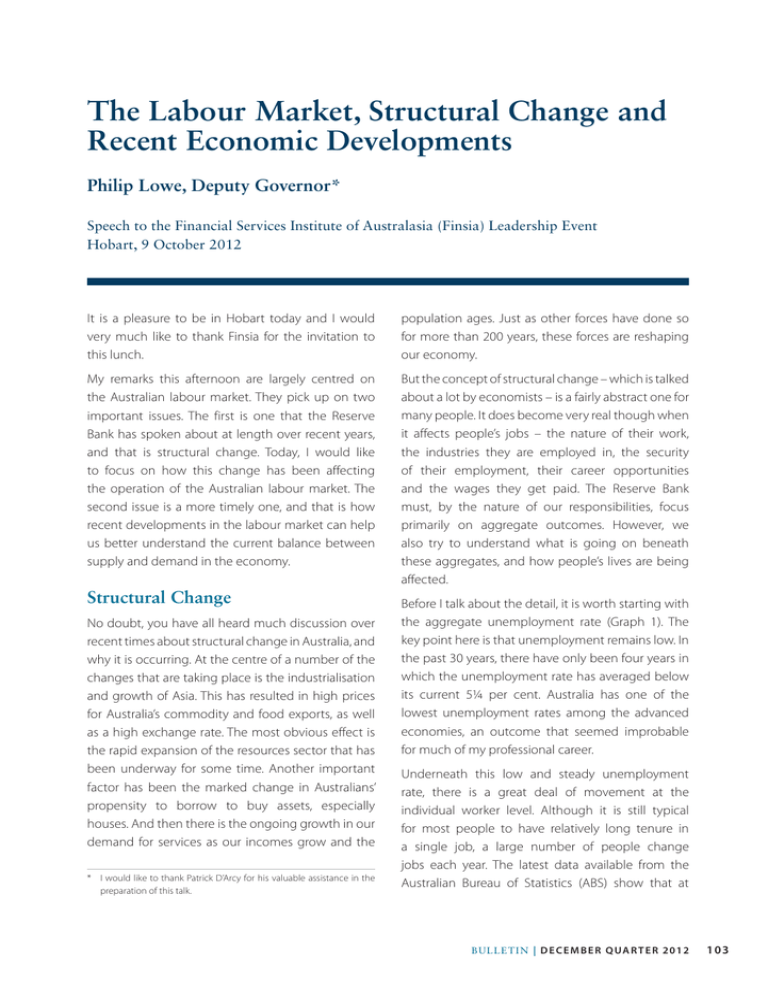
The Labour Market, Structural Change and Recent Economic Developments Philip Lowe, Deputy Governor* Speech to the Financial Services Institute of Australasia (Finsia) Leadership Event Hobart, 9 October 2012 It is a pleasure to be in Hobart today and I would very much like to thank Finsia for the invitation to this lunch. population ages. Just as other forces have done so for more than 200 years, these forces are reshaping our economy. My remarks this afternoon are largely centred on the Australian labour market. They pick up on two important issues. The first is one that the Reserve Bank has spoken about at length over recent years, and that is structural change. Today, I would like to focus on how this change has been affecting the operation of the Australian labour market. The second issue is a more timely one, and that is how recent developments in the labour market can help us better understand the current balance between supply and demand in the economy. But the concept of structural change – which is talked about a lot by economists – is a fairly abstract one for many people. It does become very real though when it affects people’s jobs – the nature of their work, the industries they are employed in, the security of their employment, their career opportunities and the wages they get paid. The Reserve Bank must, by the nature of our responsibilities, focus primarily on aggregate outcomes. However, we also try to understand what is going on beneath these aggregates, and how people’s lives are being affected. Structural Change No doubt, you have all heard much discussion over recent times about structural change in Australia, and why it is occurring. At the centre of a number of the changes that are taking place is the industrialisation and growth of Asia. This has resulted in high prices for Australia’s commodity and food exports, as well as a high exchange rate. The most obvious effect is the rapid expansion of the resources sector that has been underway for some time. Another important factor has been the marked change in Australians’ propensity to borrow to buy assets, especially houses. And then there is the ongoing growth in our demand for services as our incomes grow and the * I would like to thank Patrick D’Arcy for his valuable assistance in the preparation of this talk. Before I talk about the detail, it is worth starting with the aggregate unemployment rate (Graph 1). The key point here is that unemployment remains low. In the past 30 years, there have only been four years in which the unemployment rate has averaged below its current 5¼ per cent. Australia has one of the lowest unemployment rates among the advanced economies, an outcome that seemed improbable for much of my professional career. Underneath this low and steady unemployment rate, there is a great deal of movement at the individual worker level. Although it is still typical for most people to have relatively long tenure in a single job, a large number of people change jobs each year. The latest data available from the Australian Bureau of Statistics (ABS) show that at B u l l e tin | d e c e m b e r Q ua r t e r 2012 103 The L a bou r M a r k e t, S t ruct ur a l C h a n g e a n d Re c e n t Ec o n o mic De ve l o p me n ts Graph 1 February 2012 around 2.3 million people – almost one-fifth of the total number of employed people – were newly employed, having been in their job for less than a year. While a little under half of these were starting work for the first time or were not previously working, 1.2 million people moved from one job to another. And this is in a year when the net growth in published employment was just 23 000. This changing in jobs occurred for a range of reasons. Around three-quarters were voluntary, including for personal reasons or to take advantage of new opportunities. The remaining quarter was involuntary, including because the previous employer went out of business or the nature of the business has changed. The structural changes in the economy are clearly one factor contributing to this movement of people. This is of course nothing new. There is always a degree of structural change occurring, and the strong growth in the resources sector is but the latest example. Nevertheless, there is some evidence that the changes taking place have led to a higher rate of job turnover in recent times than has been the case for the past two decades (Graph 2). The number of people who left a job over the year to February 2012, as a share of those employed some time during the year, was the highest in two decades, with fairly high rates of both voluntary and involuntary separations. 1 04 R es erv e ba nk of Aus t r a l i a Graph 2 This high rate of turnover, with relatively modest aggregate employment growth, is consistent with a lot of new job opportunities opening up in various parts of the economy and, at the same time, other jobs ceasing to exist. Another indication of this is that the official measure of job vacancies has remained relatively high, yet employment growth has been relatively subdued. An additional way of looking at these changes is to examine the dispersion – or standard deviation – in employment growth across the 19 industries for which the ABS publishes data (Graph 3). For a number of years now, there has been a high dispersion in employment growth across these industries, with especially strong growth in the mining sector. Graph 3 T he L a b o ur M a rke t, S t ruct ura l Ch an ge an d Re c e n t Ec o n o mic De ve l o p me n ts The cumulative effect of this dispersion in growth rates can be seen in total employment growth in different industries (Graph 4). Since 2007, around 300 000 net new jobs have been created in the healthcare sector, 200 000 jobs in professional and scientific services and around 130 000 jobs in each of the mining and education sectors. In contrast, the number of manufacturing jobs has declined by around 70 000, and the number of jobs in retailing is largely unchanged. Graph 5 Graph 4 These disparate trends have added to a general sense of uncertainty in many parts of the community. Job losses can be very disruptive when they occur. They tend to be more visible than job gains. And they often take place all at once when firms are downsizing or closing, rather than the more gradual process of job creation. The large variation in experience across industries is probably one reason why many people view the labour market to be quite weak. Over the past year, we have had the rather unusual situation in which consumers have become quite concerned about rising unemployment, yet the overall unemployment rate has been steady (Graph 5). of unemployment rates across the 68 regions for which the ABS publishes data with the distribution of unemployment rates 10 years ago (Graph 6). The picture is pretty clear: the average unemployment rate is lower and the variation across the country is also lower. Today, around half the regions have unemployment rates below 5 per cent and 50 of the 68 regions have an unemployment rate below 6 per cent. In only three regions is the unemployment rate above 8 per cent, compared with 13 regions a decade ago. Graph 6 More positively, and to the surprise of many people, the significant variation in employment growth across industries has not led to greater variation in the unemployment rates across the country. One way to see this is to compare the distribution B u l l e tin | d e c e m b e r Q ua r t e r 2012 105 The L a bou r M a r k e t, S t ruct ur a l C h a n g e a n d Re c e n t Ec o n o mic De ve l o p me n ts One factor that has played at least some role in these outcomes is the willingness of people to travel or move to where the jobs are. The most high-profile example of this is perhaps the FIFO – fly-in fly-out – and the DIDO – drive-in drive-out – workers. Industry estimates and recent census data suggest that there are currently upwards of 50 000 such workers. Internal migration, of course, has also played some role, with the rate of net interstate migration to Western Australia over the past year the highest for around 25 years (Graph 7). It is also worth noting that interstate migration has played an important role in the Tasmanian economy, with the situation switching from sizeable net inflows to net outflows and back again over the course of just a few years. For a period in the 2000s, internal migration was adding around ½ per cent to Tasmania’s population annually. Today, it is subtracting almost this amount. Graph 7 The structural changes that have taken place across the economy have also altered the relative wages in different industries. Workers in the resource sector have long been paid higher wages than in many other industries, and this gap has widened over recent years (Graph 8). Since 2004, average wages in mining have increased by about 10 per cent relative to the average for the economy as a whole. Workers in professional services have also experienced fasterthan-average increases, partly due to spillover effects 1 06 R es erv e ba nk of Aus t r a l i a Graph 8 from the resources sector. Conversely, relative wages have declined in the manufacturing, retail and the accommodation industries, each of which has experienced difficult conditions over recent times. These divergent trends since the mid 2000s stand in contrast to the period immediately before that, when there was less structural change. The overall impression from these various facts and figures is that the labour market has coped reasonably well with the significant changes taking place in the Australian economy. While there have been shortages of skilled workers in some areas, these have been fairly limited. Workers have moved in large numbers to the industries that are benefiting from growth in Asia and the increasing domestic demand for services. They have done this at a time of close to full employment and larger divergences in unemployment rates across the country have been avoided. The adjustment of relative wages has helped, and this adjustment has occurred without igniting the type of economy-wide wages blowout that contributed to the derailment of previous mining booms. One reason that things have worked out this way is that the industrial relations system is more flexible than it was two decades ago. The exchange rate appreciation has also been an important factor, helping to maintain a reasonable balance between T he L a b o ur M a rke t, S t ruct ura l Ch an ge an d Re c e n t Ec o n o mic De ve l o p me n ts demand and supply during what has turned out to be a once-in-a-century investment boom. Another factor has been Australia’s monetary policy regime, which has provided a strong anchor for both inflation and wage expectations. After two decades of the inflation-targeting regime there is a fairly broad understanding that unsustainable aggregate wage growth is likely to lead to higher inflation, and thus higher interest rates. Looking forward, it is clear that the structure of the economy will continue to evolve. Over time, the strong growth in investment in the resources sector will give way to a large increase in exports of resources. This will likely mean some moderation in the demand for labour in the resources sector, and other forms of activity and employment will need to pick up. As this transition occurs, the types of new jobs that are created will also continue to evolve. Inevitably, there are uncertainties as to what these new jobs will be, and where they will be located. In the face of this uncertainty, it is essential that the labour market retains its flexibility. The industrial relations laws and practices are important here, but they are by no means the full story. Flexibility also comes from having an adaptable workforce – one that has the right general skills, the right training and the right mindset. Over the medium term, whether or not Australia fully capitalises on the opportunities that the growth of Asia presents depends critically upon the ability of both workers and businesses to adapt, and to build and use our human capital. Many of these opportunities lie beyond the resources sector – in areas like the unique tourism experiences that are possible here in Tasmania, in high-end manufacturing, in high-quality food and in professional services. If we are to take advantage of these opportunities, a highly skilled and outwardlooking workforce is critical. Recent Outcomes I would now like to shorten my gaze a little to look at quite recent developments in the labour market and what they tell us about the overall balance between supply and demand. As I discussed at the outset, the current national unemployment rate is 5¼ per cent, and has been in the 5 to 5¼ per cent range for two years now. As I said, this is a very good outcome by international standards. Notwithstanding this, the labour market appears to have generally softened in recent months, with only modest growth in total employment, a decline in average hours worked, and a decline in the employment-to-population ratio (Graph 9). Various indicators also suggest a lower rate of job creation than was the case a while ago. Graph 9 Two industries stand out as having particularly weak employment growth over recent times (Graph 10). The first is the construction industry where, according to the ABS, there has been a net decline in employment of 70 000 over the past 12 months. Activity in important parts of the industry – including in house building and commercial construction – remains subdued, as does the immediate outlook, and this has led to a fair amount of job shedding. The second industry is public administration, where employment has fallen by 50 000 over the past year, with governments cutting back due to budgetary pressures. B u l l e tin | d e c e m b e r Q ua r t e r 2012 107 The L a bou r M a r k e t, S t ruct ur a l C h a n g e a n d Re c e n t Ec o n o mic De ve l o p me n ts Graph 10 The Reserve Bank has recently spent some time trying to understand what is happening here and what it says about the balance of supply and demand in the labour market. On the supply side, demographic changes are potentially an important factor. As with many other countries, the Australian population is ageing. This tends to reduce labour force participation, as older people are less likely to have a job, or be looking for a job, than are younger people. Our estimate is that this ageing effect, by itself, has reduced the participation rate by around 1 percentage point since the mid 2000s. One interesting aspect of the recent outcomes is that despite only modest overall employment growth, the unemployment rate has not moved up, as had been widely expected. Part of the reason for this is that there has been a decline in labour force participation – that is, in the share of the working-age population either with a job or looking for a job (Graph 11). While one always needs to interpret short-run movements with caution, the current participation rate is around ½ a percentage point lower than the average of the past five years. This stands in contrast to the general upward trend in participation over the past 30 years. Graph 11 Over this period, however, this effect has been more than offset by the higher participation of successive generations of women in the workforce as well as a tendency for older workers in general to participate in the workforce longer than their predecessors. Taking account of this so-called cohort effect, as well as the ageing effect, it would appear that these longer-term supply-side factors are not a central part of the recent decline in participation. A second potential factor is the relatively high rate of structural change in employment that I talked about earlier. With the increased rate of job turnover, it may be the case that workers who have left a job have decided not to re-enter the labour market immediately. This could be for a variety of reasons – perhaps employment prospects are poor or perhaps they are seeking to update their skills before re-entering the labour force. Unfortunately, the existing data make it difficult to assess how important these effects are. To the extent that they are playing some role, there is likely to be a bit more capacity in the labour market than indicated by the unemployment rate alone. A third possibility is that the decline in participation is linked to the recent fall in demand for construction workers. There has been a large decline in the number of people who identify themselves as being 1 08 R es erv e ba nk of Aus t r a l i a T he L a b o ur M a rke t, S t ruct ura l Ch an ge an d Re c e n t Ec o n o mic De ve l o p me n ts self-employed and many of these worked in the construction industry. It may be the case that some of these people are not recorded as unemployed, despite actually not working in the reference week and being available for additional work. Again, if this were the case it would suggest that there is a bit more capacity in the labour market than suggested by the unemployment rate alone. This weakness in the construction sector, particularly of new homes, has been one of the bigger surprises in the economic outcomes over recent times. Looking forward, a pick-up in construction activity is one of the factors that could provide an offset to the eventual moderation in the current very high level of investment in the resources sector. A pick-up in other forms of investment could also play this role. With the peak in mining investment now coming into view, it is not surprising that attention is turning to the questions of what forms of activity might pick up, where the future jobs might come from, and what combination of interest rates and exchange rates might keep the overall economy on an even keel. No doubt, international developments will have an important bearing on the answers to these questions. Recently, the global outlook has softened somewhat and the various indicators that I have just mentioned suggest the labour market also has moved in this direction. Given these developments, and the outlook for contained inflation, the Board judged at its meeting last week that it was appropriate for the stance of monetary policy to be a little more accommodative than it had been. Despite the recent focus on the weaker global economy, it is important not to lose sight of the longer-term benefits to the Australian economy of the growth of Asia. It remains the case that this growth provides Australia with tremendous opportunities. Over recent years we have seen these in the resources sector. But in coming years we are likely to see them more clearly in a wide range of other areas. Our flexible, adaptive and well-trained workforce will be the key to taking advantage of these opportunities. Thank you for listening and I would be very happy to answer any questions. R B u l l e tin | d e c e m b e r Q ua r t e r 2012 109 1 10 R es erv e ba nk of Aus t r a l i a
