Preliminary results on the 3D voxel model
advertisement
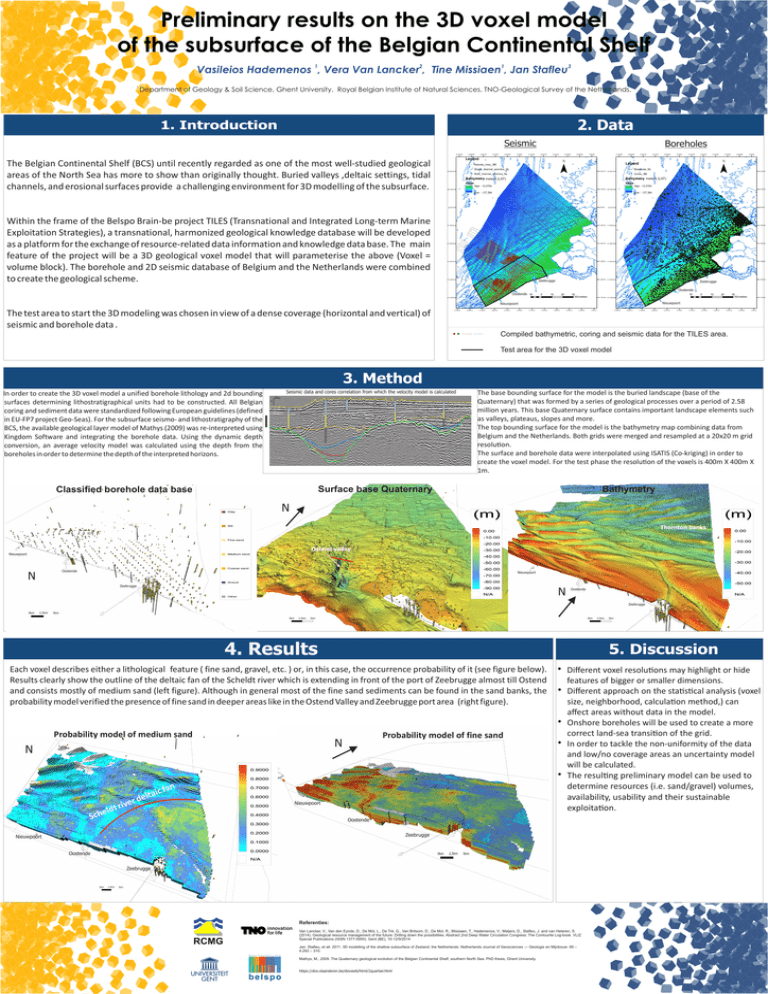
Preliminary results on the 3D voxel model of the subsurface of the Belgian Continental Shelf 1 2 1 3 VasiIeios Hademenos , Vera Van Lancker , Tine Missiaen , Jan Stafleu 1 Department of Geology & Soil Science, Ghent University. Royal Belgian Institute of Natural Sciences. TNO-Geological Survey of the Netherlands. 2. Data 1. Introduction Seismic The Belgian Continental Shelf (BCS) until recently regarded as one of the most well-studied geological areas of the North Sea has more to show than originally thought. Buried valleys ,deltaic settings, tidal channels, and erosional surfaces provide a challenging environment for 3D modelling of the subsurface. Boreholes meters (LAT) meters (LAT) Within the frame of the Belspo Brain-be project TILES (Transnational and Integrated Long-term Marine Exploitation Strategies), a transnational, harmonized geological knowledge database will be developed as a platform for the exchange of resource-related data information and knowledge data base. The main feature of the project will be a 3D geological voxel model that will parameterise the above (Voxel = volume block). The borehole and 2D seismic database of Belgium and the Netherlands were combined to create the geological scheme. Zeebrugge Zeebrugge Oostende Oostende Nieuwpoort Nieuwpoort The test area to start the 3D modeling was chosen in view of a dense coverage (horizontal and vertical) of seismic and borehole data . Compiled bathymetric, coring and seismic data for the TILES area. Test area for the 3D voxel model 3. Method In order to create the 3D voxel model a unified borehole lithology and 2d bounding surfaces determining lithostratigraphical units had to be constructed. All Belgian coring and sediment data were standardized following European guidelines (defined in EU-FP7 project Geo-Seas). For the subsurface seismo- and lithostratigraphy of the BCS, the available geological layer model of Mathys (2009) was re-interpreted using Kingdom Software and integrating the borehole data. Using the dynamic depth conversion, an average velocity model was calculated using the depth from the boreholes in order to determine the depth of the interpreted horizons. The base bounding surface for the model is the buried landscape (base of the Quaternary) that was formed by a series of geological processes over a period of 2.58 million years. This base Quaternary surface contains important landscape elements such as valleys, plateaus, slopes and more. The top bounding surface for the model is the bathymetry map combining data from Belgium and the Netherlands. Both grids were merged and resampled at a 20x20 m grid resolu on. The surface and borehole data were interpolated using ISATIS (Co-kriging) in order to create the voxel model. For the test phase the resolu on of the voxels is 400m X 400m X 1m. Seismic data and cores correlation from which the velocity model is calculated 300m 5m Surface base Quaternary Classified borehole data base Bathymetry N Thornton banks Ostend valley Nieuwpoort Oostende N Nieuwpoort Nieuwpoort Zeebrugge N Oostende Oostende Zeebrugge Zeebrugge 0km 2,5km 5km 0km 2,5km 5km 0km 4. Results 2,5km 5km 5. Discussion Each voxel describes either a lithological feature ( fine sand, gravel, etc. ) or, in this case, the occurrence probability of it (see figure below). h Different voxel resolu ons may highlight or hide Results clearly show the outline of the deltaic fan of the Scheldt river which is extending in front of the port of Zeebrugge almost till Ostend features of bigger or smaller dimensions. and consists mostly of medium sand (left figure). Although in general most of the fine sand sediments can be found in the sand banks, the h Different approach on the sta s cal analysis (voxel size, neighborhood, calcula on method,) can probability model verified the presence of fine sand in deeper areas like in the Ostend Valley and Zeebrugge port area (right figure). affect areas without data in the model. h Onshore boreholes will be used to create a more correct land-sea transi on of the grid. Probability model of medium sand Probability model of fine sand h In order to tackle the non-uniformity of the data N N and low/no coverage areas an uncertainty model will be calculated. h The resul ng preliminary model can be used to determine resources (i.e. sand/gravel) volumes, n a f ic a t l availability, usability and their sustainable e d r Nieuwpoort e v i r t exploita on. d l e Sch Oostende Zeebrugge Nieuwpoort Oostende 0km 2,5km 5km Zeebrugge 0km 2,5km 5km Referenties: Van Lancker, V., Van den Eynde, D., De Mol, L., De Tré, G., Van Britsom, D., De Mol, R., Missiaen, T., Hademenos, V., Maljers, D., Stafleu, J. and van Heteren, S. (2014). Geological resource management of the future: Drilling down the possibilities. Abstract 2nd Deep Water Circulation Congress: The Contourite Log-book. VLIZ Special Publications (ISSN 1377-0950). Gent (BE), 10-12/9/2014 Jan. Stafleu, et all. 2011. 3D modelling of the shallow subsurface of Zeeland, the Netherlands. Netherlands Journal of Geosciences — Geologie en Mijnbouw :90 – 4:293 – 310: Mathys, M., 2009. The Quaternary geological evolution of the Belgian Continental Shelf, southern North Sea. PhD thesis, Ghent University. https://dov.vlaanderen.be/dovweb/html/2quartair.html
