ELECTRIC TRANSMISSION LINES: IS THERE AN IMPACT ON RURAL LAND VALUES? BY THOMAS JACKSON, Ph.D., AICP, MAI, CRE, FRICS
advertisement
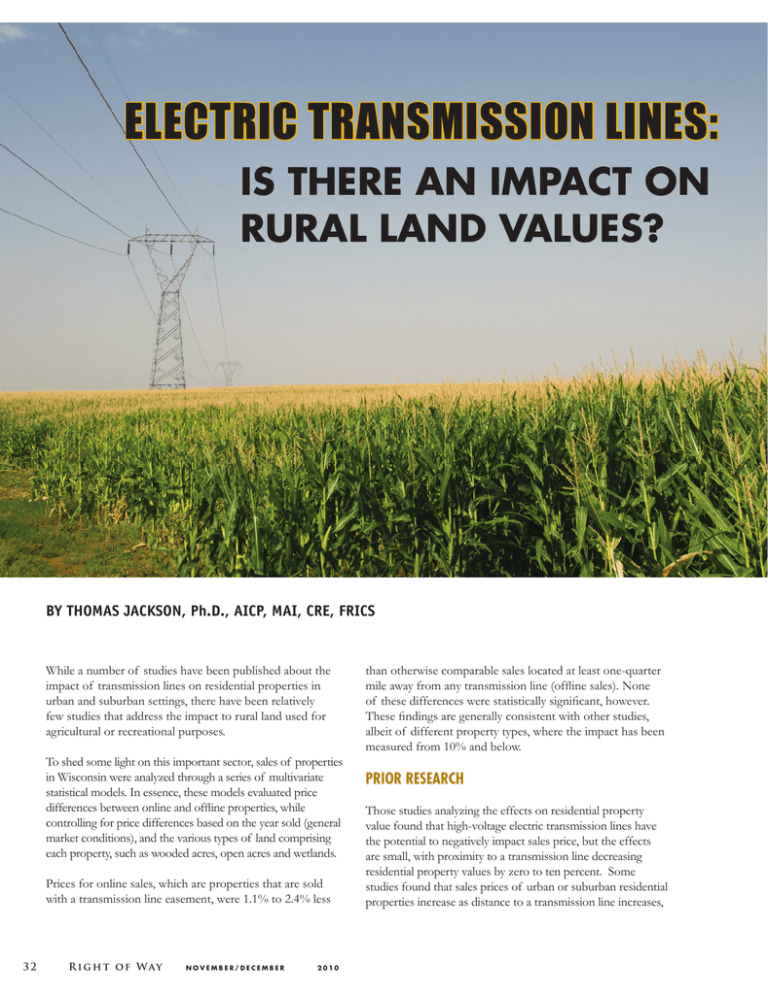
ELECTRIC TRANSMISSION LINES: IS THERE AN IMPACT ON RURAL LAND VALUES? BY THOMAS JACKSON, Ph.D., AICP, MAI, CRE, FRICS While a number of studies have been published about the impact of transmission lines on residential properties in urban and suburban settings, there have been relatively few studies that address the impact to rural land used for agricultural or recreational purposes. To shed some light on this important sector, sales of properties in Wisconsin were analyzed through a series of multivariate statistical models. In essence, these models evaluated price differences between online and offline properties, while controlling for price differences based on the year sold (general market conditions), and the various types of land comprising each property, such as wooded acres, open acres and wetlands. Prices for online sales, which are properties that are sold with a transmission line easement, were 1.1% to 2.4% less 32 R i g h t o f W a y N O V E M B E R / D E C E M B E R 2 0 1 0 than otherwise comparable sales located at least one-quarter mile away from any transmission line (offline sales). None of these differences were statistically significant, however. These findings are generally consistent with other studies, albeit of different property types, where the impact has been measured from 10% and below. PRIOR RESEARCH Those studies analyzing the effects on residential property value found that high-voltage electric transmission lines have the potential to negatively impact sales price, but the effects are small, with proximity to a transmission line decreasing residential property values by zero to ten percent. Some studies found that sales prices of urban or suburban residential properties increase as distance to a transmission line increases, and that any negative effect typically diminishes over time. In some studies, the presence of a power line was found not to have a negative effect on residential properties at all, and properties that were one to two lots away from a tower may actually experience a market premium due to increased visual clearance and privacy. Two regression-based studies were also reviewed that considered the effects of transmission lines on rural acreage. One of these considered agricultural land from 136 to 350 acres, and the other focused on recreational properties of 10 to 160 acres. Both of these studies found that power line structures and easements do not have a significant impact on the price and value of rural acreage tracts. Lastly, a 2009 article published in The Appraisal Journal also addressed the issue of impacts on residential property values and prices using a multiple regression framework. Based on a study of residential properties in Connecticut and Massachusetts sold between 1999 and 2007 located in proximity to 345 kV transmission lines, the authors analyzed the effects of proximity and encumbrance and found proximity to have an insignificant effect on sales price. They concluded that the only variable that appears to have any kind of systematic effect is the encumbrance variable, although its statistical significance varied and the effect was generally small. The authors also addressed potential effects due to the visibility of the transmission line structures and found a lack of any significant impact on sales price. SALES PRICE ANALYSIS In the following study, as well as those previously mentioned, transmission line impacts were analyzed through a statistical modeling technique known as multiple regression analysis, a well-accepted method used for this purpose. In this type of analysis, sales price was modeled as a function of the characteristics of the property, its sale and whether or not the property had a transmission line easement. The sales data was collected by first identifying rural land transactions that involved properties with a transmission line easement. The transmission lines ranged from 115kV to 345kV, with approximately 75% at 345kV. Once the online sales were identified, comparable offline sales were selected by an experienced team of Wisconsin appraisers. Approximately three to four offline comparables for each online sale were selected on the basis of similarity in land use, property type, size and land features. The comparables were confined to the same general time period (generally bracketing the subject online sale by one year) and location in the same general market area. The sale properties (online and offline) averaged approximately 50 acres in size, with about 55% wooded and 45% open property. The tracts had approximately 3.8 acres of wetlands areas. All sales were confirmed as arms-length transactions. Two models were estimated. In the first, differences in location were measured by categorical variables indicating the county in which the sales were located. This model only included those counties that had the most statistically significant effect on sales price. The model also included the type of land as measured by the number of wooded acres, number of open acres and number of wetland acres. Wooded acres are shown to have the strongest positive effect on sales price followed by open acres. Wetland acres, which overlap the other two categories, had a negative effect. Another variable included in this model was an indicator for whether or not the sale involved a purchase by a government agency. These acquisitions typically have a significantly higher sales price than non-governmental purchases. The results of the analysis are summarized below. The adjusted prices are the average prices, adjusted or controlling for all of the differences between the online and offline sales except the online/offline characteristic. Mean Prices - Categorical Model Number of sales Unadjusted sales price Adjusted sales price Online sales 88 $119,301 $103,643 Offline sales 297 $101,591 $106,231 Online difference -$2,588 Online percent difference -2.44% p-value for difference N O V E M B E R / D E C E M B E R 2 0 1 0 p = 0.656 R i g h t o f W a y 33 The results indicated that, after adjusting for factors unrelated to the presence of a transmission line, there was a small difference of 2.44% in the prices of online and offline properties. This difference was not statistically significant, as indicated by the probability of value (p-value) of 0.656. A p-value of 0.05 or less is generally considered statistically significant. The second model substituted a land price index for the county indicator variables. The other independent variables were retained and specified in the same manner as the first model. The index variable was based upon a standard, or z-score, index which measures differences in county land prices in standard deviation units. These index scores were calculated on the basis of the average price per acre for the offline land sales in each county. The results of this model specification are summarized below. Mean Prices - Index Model Number of sales Unadjusted sales price Adjusted sales price Online sales 88 $119,301 $104,735 Offline sales 297 $101,591 $105,907 Online difference -$1,172 Online percent difference -1.11% p-value for difference p = 0.849 Again, the results indicated that properties with electric transmission lines do not sell at a significant discount to otherwise similar properties without electric transmission lines. In this model specification, the difference is -1.11%, which is lower than the -2.44% from the categorical model specification. Differences this small do not reach any acceptable level of statistical significance. In sum, these two analyses, which involve several hundred sales of rural land in various locations across central Wisconsin, indicate that the sales prices and market values of properties with electric transmission lines have not been significantly diminished due to the presence of these lines. OTHER CONSIDERATIONS Our analysis was based on the entire parcel or tract size, including the area encumbered by the transmission line 34 R i g h t o f W a y N O V E M B E R / D E C E M B E R 2 0 1 0 easement. Accordingly, the diminution estimates would apply to the total or gross acreage of the online tracts. Another perspective would be to attribute the entire loss to the encumbrance of the easement area. Calculation of the extent of the encumbrance can be accomplished by first determining an average easement area. Data on 79 online sales properties indicated that the average easement width was 139.9 feet. Data on 88 online sales properties indicated an average easement length of 1,187.5 feet for a total easement size of approximately 3.8 acres. Further, data on the 88 online sales properties indicated an average size of 62.84 acres.* The average unadjusted price per acre for the online sales was approximately $1,898.49 per acre ($119,301 ÷ 62.84 acres). Applying the entire estimated loss from the categorical model of $2,588 to just the approximate average value of easement area (3.8 acres × $1,928 or $7,233.25) indicates an encumbrance or loss to just the easement area of 35.8%. Using the estimated loss from the index model of $1,172 indicates an encumbrance factor of 16.2%. Both of these factors assume no loss to the remainder. Lastly, another consideration involves the placement of the easement across the tract. Four location categories were used: middle, edge, clipping and diagonal. An edge pattern (Figure A) would be associated with easements along a road or highway while a clipping (Figure B) would generally be along the highway but would cross a small portion of the property. The clipping and edge patterns occurred in 60% (53 of the 88) of the online sales used in the statistical analysis. The middle pattern (Figure C) occurs when the easement is close to or in the middle of the property but not on a diagonal. This occurred in 31% of the online sales. The diagonal pattern (Figure D) crosses over from one-third to near the middle of the property. This pattern was least frequent, at 9% of the total online sales used in the analysis. Preliminary regression models, similar to the categorical model described above, were used to estimate online and offline price differences depending on these easement locations. The results indicated that online sales in the middle pattern had an average adjusted price difference of -3.8%. The diagonal pattern was associated with a difference of -2.1%. The edge/clipping pattern sales had no loss. SUMMARY The analyses presented here investigated the extent to which rural land values in Wisconsin have been adversely impacted by the presence of high-voltage electric transmission lines. The general finding was that there were small (1.11% to 2.44%) * The larger average size for online compared to offline sales properties would account for a higher unadjusted sales price. Statistical adjustments explains the differences between the unadjusted and adjusted average sales prices in the two summary tables. Road Figure A - Edge Position MAP LEGEND Ro ad Roa d Road Transmission Structures Transmission Route Line Property ROAD Tax Parcel Boundary Ro ad Minor Civil Division Township d Roa Ro ad Section WWI Wetland Field Wetland 0 100 200 400 Feet NOVEMBER 30, 2009 The information presented in this document is advisory and intended for reference purposes only. American Transmission Company owned and operated facility locations are approximate. Data sources: Dane County Land Information Office WDNR. Date of Photography: Summer 2008 Figure B - Clipping MAP LEGEND Old H-Frame Structures New Transmission Structures Transmission Route discounts that could be attributable to the presence of the lines and the encumbrance of the properties by the easements. Neither of these small differences were statistically significant. Nonetheless, these findings are consistent with previous findings, which indicated relatively small or non-existent differences. While prior studies had focused primarily on residential properties in urban settings, previous studies of farmland and recreational land found no impact on property values. Furthermore, the extent to which the easement area was encumbered and/or differences in impact due to the position of the easement and transmission lines, were found to be insignificant. In this regard, the encumbrance factors were found to range from 16.0% to 35.3%, assuming no damages to the remainder. Middle and diagonal line positions across the property were found to account for overall price reductions of 3.84% to 2.11% based on preliminary analyses. The patterns referred to as edge or clipping were not found to result in any price differences. Line Property Tax Parcel Boundary Minor Civil Division Township Section Qtr Qtr Section WWI Wetland ROAD 0 150 300 600 Feet NOVEMBER 20, 2008 The information presented in this document is advisory and intended for reference purposes only. American Transmission Company owned and operated facility locations are approximate. Data sources: Marathon County Planning, Oconto County Land Information Office, Outagamie County Planning, Shawano County Land Information Office, Waupaca County Land Information Office, East Central Regional Planning Commission, WDNR, WDOA, ANR Pipeline. Date of Photography: November 2004 S. W. Hamilton & G. M. Schwann, “Do High Voltage Electric Transmission Lines Affect Property Value?” Land Economics, Volume 71, Number 4 (November 1995): 436-444; and F. Des Rosiers, “Power Lines, Visual Encumbrance and House Values: A Microspatial Approach to Impact Measurement,” Journal of Real Estate Research Volume 23, Number 3 (2002). P. F. Colwell & K. W. Foley, “Electric Transmission Lines and the Selling Price of Residential Property,” The Appraisal Journal, Volume 47, Number 4 (October 1979): 490-499. P. F. Colwell, “Power Lines and Land Value,” Journal of Real Estate Research, Volume 5, Number 1 (Spring 1990): 117:127. Road Figure C - Middle Position Road Road Road References MAP LEGEND 115 kV 345 kV M. L. Wolverton & S. C. Bottemiller, “Further Analysis of Transmission Line Impact on Residential Property Values,” The Appraisal Journal (July 2003): 244-252. Des Rosiers. Existing Structures Proposed Structures Road Transmission Route Easement Parcels Gunnulson Property Road G. J. Rigdon, “138Kv Transmission Lines and the Value of Recreational Land,” Right of Way (December 1991): 8-19. Tax Parcel Boundary Minor Civil Division Township ROAD D. Brown, “The Effect of Power Line Structures on Farm Land Values,” Right of Way (December 1975- January 1976). J. A. Chalmers and F. A. Voorvaart, “High-Voltage Transmission Lines: Proximity, Visibility and Encumbrance Effects,” The Appraisal Journal, 2009, Summer 2009, 227-245. Section Road Road Qtr Qtr Section WWI Wetland T. O. Jackson, “Evaluating Environmental Stigma with Multiple Regression Analysis,” The Appraisal Journal, 2005, Vol. 73, No. 4, 363-369. Field Wetland 0 250 500 1,000 Feet OCTOBER 08, 2009 The information presented in this document is advisory and intended for reference purposes only. American Transmission Company owned and operated facility locations are approximate. Data sources: Dane County Land Information Office WDNR. Date of Photography: Summer 2008 Road Figure D - Diagonal Position MAP LEGEND Transmission Structures Road Transmission Route Line Property Roa d Tax Parcel Boundary Minor Civil Division Township Section Qtr Qtr Section WWI Wetland Thomas Jackson, Ph.D., AICP, MAI, CRE, FRICS Tom is the President of Real Property Analytics, Inc. in College Station, TX, and specializes in real estate impacted by environmental contamination. He has over 28 years experience in valuation of real property, real estate consulting and urban planning. Tom is a Clinical Associate Professor at the Mays Business School at Texas A&M University, and has taught real property valuation, land development and land use planning. A renowned researcher and author, he also developed a seminar called “Analyzing the Effects of Environmental Contamination on Real Property” for the Appraisal Institute and webinar entitled “Oil Spills and Property Values.” Aerial Delineated Wetland 0 150 300 600 Feet The information presented in this document is advisory and intended for reference purposes only. American Transmission Company owned and operated facility locations are approximate. Data sources: Marathon County Planning, Oconto County Land Information Office, Outagamie County Planning, Shawano County Land Information Office, Waupaca County Land Information Office, East Central Regional Planning Commission, WDNR, WDOA, ANR Pipeline. Date of Photography: November 2004 APRIL 29, 2008 N O V E M B E R / D E C E M B E R 2 0 1 0 R i g h t o f W a y 35
