Connectivity between MPAs Galice Hoarau
advertisement
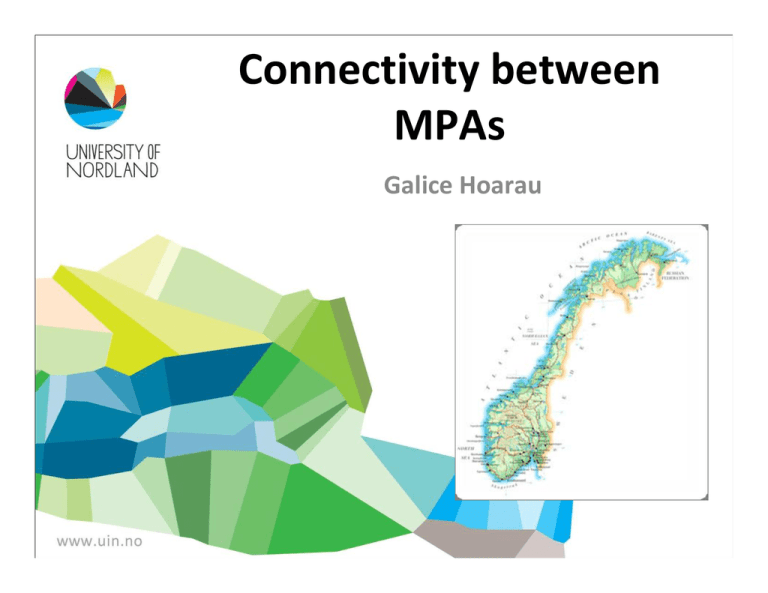
Connectivity between MPAs Galice Hoarau Norwegian Marine Environment • The Norwegian coastline stretches over 2.500 km (> 83.000 km including fjords and islands) • Territorial sea area (12 nm) = 146 831 km2 • EEZ (200 nm) ≈ 1 million km2 • 80% of Norway's population lives <10 km from the sea • Essential for Norway’s economy: ‐Fisheries ‐Aquaculture ‐Oil & Gas (>20% GDP) Norwegian Marine Environment • Very diverse marine ecosystems: ‐ Cold water coral reefs ‐ Fjords –deep and long, anoxic/stagnant waters ‐ Strong currents/tidal flows ‐ Kelp forests • Marine species: •Fish & invertebrate ≈ 7500 •Macro‐algae ≈ 500 Photos www.galice.nl Marine Protected Areas in Norway • ≈150 areas along the Norwegian coast with local‐based management measures: ‐Protection of spawning grounds ‐Restriction by gear ‐Prohibition against fishing for specific species • 4 pilot MPAs established in 2006 for lobster • 8 coral reef MPAs • Total 2700 km2 (≈ 2%) • 1 National Park Coral reef MPAs Lobster MPAs Knutsen et al 2009 Ytre Hvaler Marine National Park • Officially opened in September 2009 • 354 km2,14 km2 of which are land • Maximum depth > 470 m • 6,000 marine species, including 220 on Norwegian and Swedish lists of endangered species • Tisler Coral Reef: <1200 m long and 200 m broad, the largest inshore reef in Europe • Adjacent to Kosterhavets National Park in Sweden. • Formal cross‐border collaboration • Sweden and Norway’s first transboundary marine park Photos Photos Ytre Hvaler National Park Container vessel Godafoss grounded by Asmaløy on 17 february 2011 • Nearly 500 tons of fuel oil spilled • Difficult cleaning due to ice • Impact on the bird populations Photo Greenpeace Svalbard • Part of the Kingdom of Norway • Free economic zone & demilitarized zone • 7 national parks ‐ Marine ≈20,000 km2 • 21 nature reserves ‐ Marine ≈ 58,000 km2 • In total: 86% of the territorial waters are protected (65% of the land) Photos www.galice.nl National Plan for MPAs •National goal: protect at representative selection of nature • Strategy: protect a broad range of habitats and thereby a broad range of species • National Advisory Committee for MPAs (Skjoldal report 2003): Proposal for 36 marine protected areas ranging in size from 5 to 3450 km2, total 16,000 km2 ‐ Distribution of benthic species along the coast ‐ 3 biogeographic regions Barent Sea Norwegian Sea North Sea / Skagerrak ‐ 6 categories: Pools (closed marine basins) Fjords Strong currents areas Shallow water areas Open coastal areas Transect from coast to shelf National Plan for MPAs 2011 • 17 areas are now in the establishment phase • Hearings have started for the remaining 19 areas • Restriction levels will depend on the specific conservation values in each candidate area • Balance between conservation and exploitation, “there should be no more restrictions than are considered necessary to protect the conservation values” Goals of MPAs •Conservation: ‐Preservation of biodiversity ‐Preservation of particular species ‐Preservation of ecosystems and ecosystem services • Fisheries management Goals of MPAs • Conservation • Fisheries management ‐ Prevent the collapse of overexploited stocks ‐ Increase the size of the catchable stock Matching MPAs Design and Objectives Conservation: ‐Preservation of biodiversity ‐Preservation of particular species ‐Preservation of ecosystems and ecosystem services Biodiversity representation Genetic diversity Self‐sustaining populations Fisheries management ‐ Prevent the collapse of overexploited stocks ‐ Increase the size of the catchable stock Export of large fishes Export of larvae Halpern & Warner 2003 Proc. R. Soc. Lond. B Single Reserve • Majority of the world MPAs are single reserves • Locations mostly based on non biological factors • Only a very small fraction of the ocean is protected • Large benefit mostly within the reserves ‐Biomass ‐Density ‐Size ‐Diversity Lester et al 2009 Mar. Ecol. Prog. Ser. Single reserve Size vs. dispersal Halpern & Warner 2003 Proc. R. Soc. Lond. B Weakness of single reserve • For most marine species, individual MPAs have a minor conservation benefit for the species as a whole • To provide significant conservation benefit they must be scaled up: ‐Increase the size dramatically ‐Network of MPAs Networks as imperatives for MPAs …. the establishment of marine protected areas consistent with international law and based on scientific information, including representative networks by 2012 …. complete, designate, finance and ensure effective, management of the Natura 2000 network by 2010 (2012 for marine sites) ….. establishing an ecologically coherent network of well‐ managed MPAs in the North‐East Atlantic by 2010 …. establishing a well‐managed and ecologically coherent network of Marine Protected Areas (MPAs) by 2012 (England & Wales) Network of MPAs • Increased focus on networks of MPAs • Advantage of networks: ‐Synergistic effect ‐Protection of broader variety of habitat types ‐Facilitated connectivity among sites to sustain threatened populations ‐Reduce/Eliminate cost to fisheries ‐Facilitate both conservation and fisheries goals • Two successful networks of marine reserves: • Success of network depends on size, spacing and location ‐> connectivity PNAS Special Feature 2010 Persistence in a MPA network • Self‐persistence of local populations • Persistence depending on connectivity • Demographic synergy Gaines et al 2010 PNAS Connectivity • “The extent to which populations in different parts of a species range are linked by exchange of larvae, recruits, juveniles, or adults” • A network of MPAs should maximize connectivity between individual MPAs to ensure the protection of ecological functionality and productivity • Connectivity and ecological linkages include: ‐Connections of linked habitats ‐Connections through larval dispersal between and within MPAs ‐Regular settlement of larvae from one MPA to another MPA ‐Adults movements within, between and outside of MPAs • Importance of a system‐wide approach in the design of MPA and MPA networks: ‐Patterns of connectivity within and among ecosystems ‐Connectivity between two populations Palumbi 2003 Ecological Applications Jones et al 2007 Oceanography Structure of Marine Population Single (patchy or continuous) population discrete populations High (open) isolated populations Low Population Connectivity (closed) Structure of Marine Populations • Many marine species have bipartite life histories: ‐ Restricted movement of adults ‐ Early life history stages (e.g. eggs and larvae) can disperse wide distances ‐ Larvae are essentially planktonic • But marine species can have: ‐Long distance dispersal of adults ‐No or very short planktonic phase Structure of Marine Populations • Paradigm ‐ Larval dispersal connects local populations over large distances → Marine populations are open • BUT more and more evidence show that (some) marine populations are more closed than originally thought Assessing Connectivity 1. Larval duration & dispersal distance Shanks 2009 Biol. Bull. Allison et al 1998 Ecological Applications • Can pelagic larval duration predict dispersal distance? • Sort of … ‐short pelagic phase ↔short distance ‐long pelagic phase ↔long distance but many discrepancies • not only passive Assessing connectivity 2. Tagging • Tagging of adults ‐ Simple mark/recapture ‐ Sophisticated tags, GPS, data logger (DST) ‐ Does not integrate a reproductive component (feeding vs. spawning migration…) Bolle et al 2005 ICES J. Mar. Sci. • Chemical / environmental tags ‐Otoliths and stratoliths micro‐chemistry ‐Both adults and larvae Halden, N. M Assessing connectivity 3. Direct genetic method – “DNA tagging” • Conceptually similar to physical/environmental tags • Focus on assignment of individuals to populations of origin or to specific parents • Use variable molecular markers to calculate the probability that a given individual originated from a particular population • Assignment methods can be use to infer immigration rates ‐Most effective when the connectivity is low (high genetic structure), can be a problem for many marine species ‐Most success in tracing source of invasive species • Parentage analysis can be used to infer larval connectivity ‐good performance in high gene flow condition but incomplete sampling of potential parents is a major drawback Hedgecock et al 2007 Oceanography Coyer et al 2006 Eur. J. Phyc. Planes et al 2009 PNAS Saenz-Aqudelo et al 2009 Mol. Ecol. Assessing connectivity 4. Indirect genetic method • Estimation of gene flow from genetic differences among population • Differentiation among population: Fst ‐standardized variance in allele frequencies among population ‐0 ≤ Fst ≤1 • Estimates of dispersal rely on theoretical models of population structure Assessing connectivity Drawbacks of Indirect genetic method • Estimation of migration become increasingly inaccurate at low population differentiation → Moderate gene flow can be indistinguishable from random mating Hedgecock et al 2007 Oceanography • Difficulties to distinguish evolutionary from contemporary gene flow • Development of new analytical tools based on coalescent theory Ferber et al 2008 MEPS Relevant Temporal Scale • Direct and indirect methods estimate connectivity on opposite ends of a temporal spectrum: ‐indirect genetic methods integrate connectivity over evolutionary time frame ‐direct methods give a “snapshot” of connectivity • Biologically relevant time frames (ecological/demographic) arein between but escape both methods Variability of Dispersal Distance Palumbi 2004 Annu. Rev. Environ. Resour. Kinlan & Gaines 2003 Ecology Connectivity and MPAs Spacing Variable Spacing Halpern & Warner 2003 Proc. R. Soc. Lond. B Connectivity and MPAs Locations Source – Sink populations Allison et al 1998 Ecological Applications Connectivity and MPAs Locations Habitat Fragmentation Jones et al 2007 Oceanography Connectivity and Resilience to Environmental Changes • High connectivity can diminish the potential for local adaptation • BUT connectivity insure the spread of successful/resilient genotype • Without connectivity populations in the southern range of a species and the local adaptations may become lost in case of a range shift due to global warming Conclusion • Connectivity is an essential parameter for MPAs and MPAs network • Marine species show a broad range of dispersal distances • High connectivity is common but not the rule • Accessing connectivity in marine species is still a major challenge • Multidisciplinary approach combining physical oceanography, larval ecology, tags and genetics are necessary • MPAs size and spacing… a difficult compromise: ‐moderate size 10s‐100s km2 ‐moderate and variable spacing 10s‐100s km
