Stat 101 – Lecture 37 Inference for
advertisement
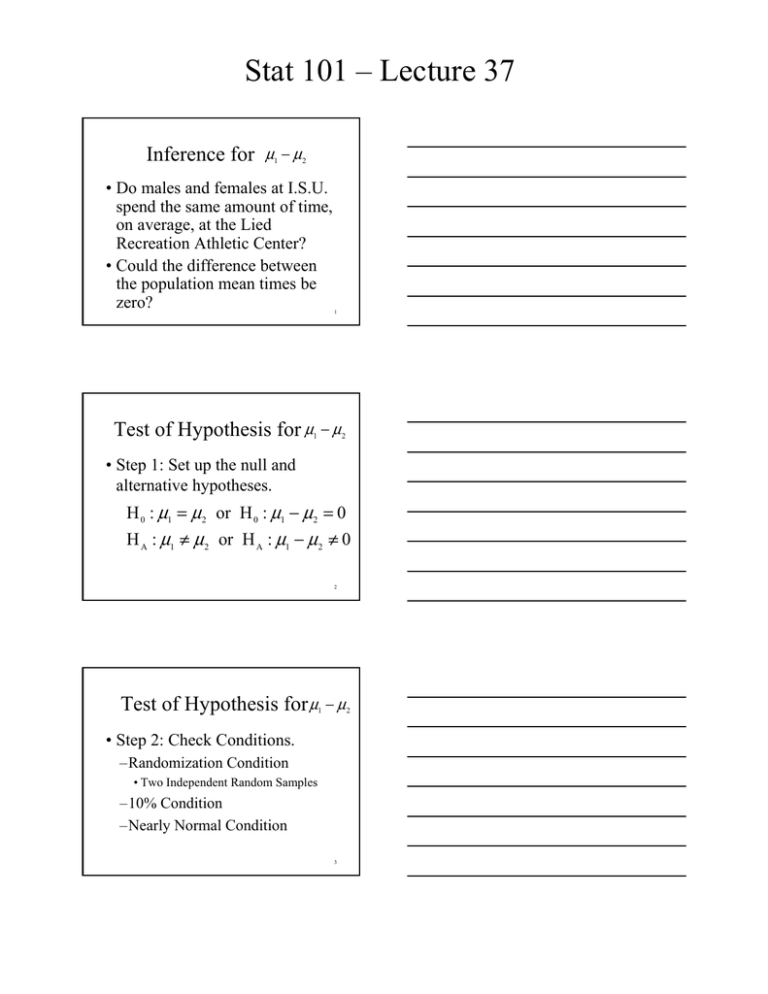
Stat 101 – Lecture 37 Inference for μ1 − μ2 • Do males and females at I.S.U. spend the same amount of time, on average, at the Lied Recreation Athletic Center? • Could the difference between the population mean times be zero? Test of Hypothesis for μ 1 − μ2 1 • Step 1: Set up the null and alternative hypotheses. H 0 : μ1 = μ2 or H 0 : μ1 − μ2 = 0 H A : μ1 ≠ μ 2 or H A : μ1 − μ2 ≠ 0 2 Test of Hypothesis for μ 1 − μ2 • Step 2: Check Conditions. –Randomization Condition • Two Independent Random Samples –10% Condition –Nearly Normal Condition 3 Stat 101 – Lecture 37 Normal Quantile Plot 3 .99 2 .95 .90 .75 Females .50 1 0 .25 .10 .05 .01 -1 -2 -3 5 Count 4 3 2 1 30 40 50 60 70 80 90 100 Time (min) 3 .99 2 .95 .90 .75 Males .50 1 0 .25 .10 .05 .01 Normal Quantile Plot 4 -1 -2 -3 5 3 2 Count 4 1 30 40 50 60 70 80 90 100 Time (min) 5 Nearly Normal Condition • The female sample data could have come from a population with a normal model. • The male sample data could have come from a population with a normal model. 6 Stat 101 – Lecture 37 Test of Hypothesis for μ 1 − μ2 • Step 3: Compute the value of the test statistic and find the P-value. ( y − y2 ) − 0 t= 1 SE( y1 − y 2 ) SE( y1 − y2 ) = s12 s22 + n1 n2 7 Time (minutes) Sex=F Mean Sex=M 55.87 Mean 69.20 Std Dev 13.527 Std Dev 13.790 Std Err Mean N 3.4927 Std Err 3.5606 Mean 15 N 15 8 SE( y1 − y2 ) = s12 s22 + n1 n2 (13.527) + (13.792) 2 = 15 2 15 = 24.88 = 4.988 9 Stat 101 – Lecture 37 Test of Hypothesis for μ 1 − μ2 • Step 3: Compute the value of the test statistic and find the P-value. t= (y − y2 ) − 0 (55.87 − 69.20) = = −2.672 SE( y1 − y2 ) 4.988 1 10 Table T Two tail probability 0.10 0.05 0.02 P-value 0.01 df 1 2 3 4 M 28 1.701 2.048 2.467 2.672 2.763 11 Test of Hypothesis for μ 1 − μ2 • Step 4: Use the P-value to make a decision. –Because the P-value is small (it is between 0.01 and 0.02), we should reject the null hypothesis. 12 Stat 101 – Lecture 37 Test of Hypothesis for μ 1 − μ2 • Step 5: State a conclusion within the context of the problem. – The difference in mean times is not zero. Therefore, on average, females and males at I.S.U. spend different amounts of time at the Lied Recreation Athletic Center. 13 Comment • This conclusion agrees with the results of the confidence interval. • Zero is not contained in the 95% confidence interval (–23.55 mins to –3.11 mins), therefore the difference in population mean times is not zero. 14 Alternatives H 0 : μ1 = μ2 H A : μ1 < μ2 , One tail prob (Pr < t ) H A : μ1 > μ2 , One tail prob (Pr > t ) H A : μ1 ≠ μ2 , Two tail prob (Pr > t ) 15 Stat 101 – Lecture 37 JMP • Data in two columns. –Response variable: • Numeric – Continuous –Explanatory variable: • Character – Nominal 16 JMP Starter • Basic – Two-Sample t-Test –Y, Response: Time –X, Grouping: Sex 17 Oneway Analysis of Time By Sex 100 90 Time 80 70 60 50 40 30 F M Sex Means and Std Deviations Level F M Number 15 15 Mean 55.8667 69.2000 Std Dev Std Err Mean 13.5270 3.4927 13.7903 3.5606 Lower 95% Upper 95% 48.376 63.358 61.563 76.837 t Test F-M Assuming unequal variances Difference -13.333 t Ratio Std Err Dif 4.988 DF Upper CL Dif -3.116 Prob > |t| Lower CL Dif -23.550 Prob > t Confidence 0.95 Prob < t -2.67326 27.98961 0.0124 0.9938 -15 -10 0.0062 18 -5 0 5 10 15
