Statistics 451 Examination 2 Name Spring 2014
advertisement
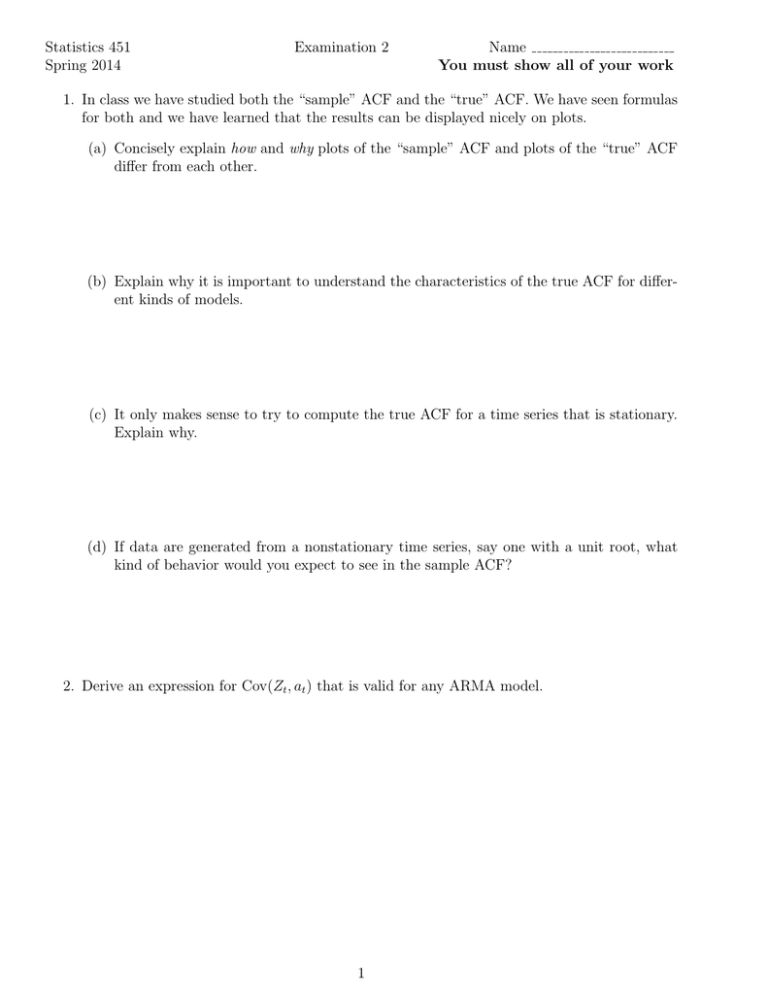
Statistics 451 Spring 2014 Examination 2 Name You must show all of your work 1. In class we have studied both the “sample” ACF and the “true” ACF. We have seen formulas for both and we have learned that the results can be displayed nicely on plots. (a) Concisely explain how and why plots of the “sample” ACF and plots of the “true” ACF differ from each other. (b) Explain why it is important to understand the characteristics of the true ACF for different kinds of models. (c) It only makes sense to try to compute the true ACF for a time series that is stationary. Explain why. (d) If data are generated from a nonstationary time series, say one with a unit root, what kind of behavior would you expect to see in the sample ACF? 2. Derive an expression for Cov(Zt , at ) that is valid for any ARMA model. 1 3. A seasonal moving average model for quarterly data is Wt = (1 − θ1 B)(1 − Θ1 B4 )at (a) Derive an expression for the variance of Wt . (b) Derive an expression for the true autocorrelation function value ρ1 of Wt . (c) Derive an expression for the true autocorrelation function value ρ3 of Wt . 4. Concisely explain the difference between a confidence interval and a prediction interval. 2 5. A time series Zt can be described by an AR(1) model. Assume that a realization Z1 , Z2 , . . . Z100 is available to estimate all of the parameters in this model and to compute forecasts and that a forecast is needed for Z102 , using Z100 as the forecast origin. (a) Give an expression for Z102 , based on the AR(1) model. (b) Give an expression that can be used to compute Zb100 (2), the forecast for Z102 . (c) Derive e100 (2), the forecast error in Zb100 (2). (d) Give an expression for the variance of e100 (2). (e) Give an expression for a 95% prediction interval for Z102 . 3 6. The AIC model-choice criterion uses the statistic AIC = −2 log(Likelihood) + 2m where m is the number of estimated parameters in the model. (a) What is the rational for the 2m term in this criterion? (b) Briefly explain why does using AIC provide a better criterion than choosing the model with the largest likelihood? 7. A normal probability plot of the residuals is a useful diagnostic for helping to develop a time series model. Specifically, what information will a normal probability plot provide? 8. Consider the model (1 − B)(1 − φ1 B)Zt = (1 − θ1 B)at where φ1 = 0.50 and θ1 = 0.30. Is this model stationary? Explain why or why not? 9. Briefly explain the logic behind the use of the range-mean plot in time series modeling. 10. Derive Cov(Zt , at−1 ) for an MA(1) model. 4
