Objective and Motivation Results
advertisement

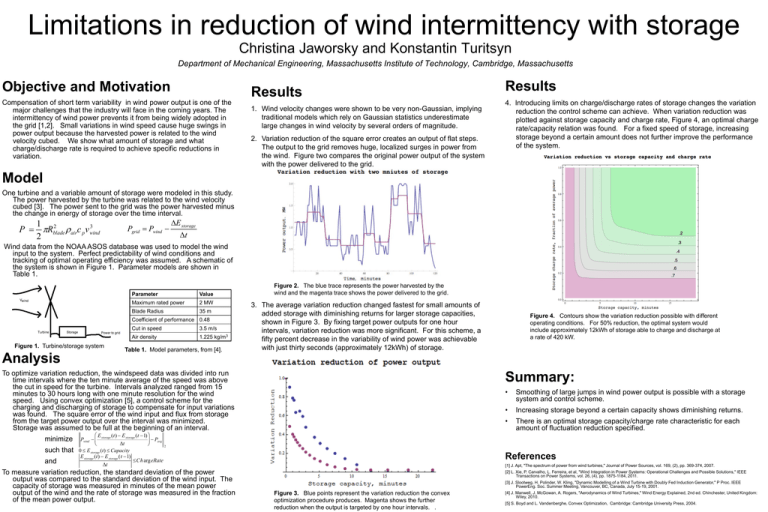
Limitations in reduction of wind intermittency with storage Christina Jaworsky and Konstantin Turitsyn Department of Mechanical Engineering, Massachusetts Institute of Technology, Cambridge, Massachusetts Objective and Motivation Results Compensation of short term variability in wind power output is one of the major challenges that the industry will face in the coming years. The intermittency of wind power prevents it from being widely adopted in the grid [1,2]. Small variations in wind speed cause huge swings in power output because the harvested power is related to the wind velocity cubed. We show what amount of storage and what charge/discharge rate is required to achieve specific reductions in variation. 1. Wind velocity changes were shown to be very non-Gaussian, implying traditional models which rely on Gaussian statistics underestimate large changes in wind velocity by several orders of magnitude. 2. Variation reduction of the square error creates an output of flat steps. The output to the grid removes huge, localized surges in power from the wind. Figure two compares the original power output of the system with the power delivered to the grid. Results 4. Introducing limits on charge/discharge rates of storage changes the variation reduction the control scheme can achieve. When variation reduction was plotted against storage capacity and charge rate, Figure 4, an optimal charge rate/capacity relation was found. For a fixed speed of storage, increasing storage beyond a certain amount does not further improve the performance of the system. Model One turbine and a variable amount of storage were modeled in this study. The power harvested by the turbine was related to the wind velocity cubed [3]. The power sent to the grid was the power harvested minus the change in energy of storage over the time interval. 1 2 3 P = πRblade ρ airc p v wind 2 Pgrid = Pwind ∆E storage − ∆t Wind data from the NOAA ASOS database was used to model the wind input to the system. Perfect predictability of wind conditions and tracking of optimal operating efficiency was assumed. A schematic of the system is shown in Figure 1. Parameter models are shown in Table 1. Parameter Value Maximum rated power 2 MW Blade Radius 35 m Coefficient of performance 0.48 Figure 1. Turbine/storage system Analysis Cut in speed 3.5 m/s Air density 1.225 kg/m3 Table 1. Model parameters, from [4]. Figure 2. The blue trace represents the power harvested by the wind and the magenta trace shows the power delivered to the grid. 3. The average variation reduction changed fastest for small amounts of added storage with diminishing returns for larger storage capacities, shown in Figure 3. By fixing target power outputs for one hour intervals, variation reduction was more significant. For this scheme, a fifty percent decrease in the variability of wind power was achievable with just thirty seconds (approximately 12kWh) of storage. To optimize variation reduction, the windspeed data was divided into run time intervals where the ten minute average of the speed was above the cut in speed for the turbine. Intervals analyzed ranged from 15 minutes to 30 hours long with one minute resolution for the wind speed. Using convex optimization [5], a control scheme for the charging and discharging of storage to compensate for input variations was found. The square error of the wind input and flux from storage from the target power output over the interval was minimized. Storage was assumed to be full at the beginning of an interval. minimize such that and Summary: E storage (t) − E storage (t −1) Pwind − − Pavg ∆t 2 0 ≤ E storage (t) ≤ Capacity E storage (t) − E storage (t −1) ≤Ch argeRate ∆t To measure variation reduction, the standard deviation of the power output was compared to the standard deviation of the wind input. The capacity of storage was measured in minutes of the mean power output of the wind and the rate of storage was measured in the fraction of the mean power output. Figure 4. Contours show the variation reduction possible with different operating conditions. For 50% reduction, the optimal system would include approximately 12kWh of storage able to charge and discharge at a rate of 420 kW. • Smoothing of large jumps in wind power output is possible with a storage system and control scheme. • Increasing storage beyond a certain capacity shows diminishing returns. • There is an optimal storage capacity/charge rate characteristic for each amount of fluctuation reduction specified. References [1] J. Apt, "The spectrum of power from wind turbines," Journal of Power Sources, vol. 169, (2), pp. 369-374, 2007. [2] L. Xie, P. Carvalho, L. Ferreira, et al, "Wind Integration in Power Systems: Operational Challenges and Possible Solutions," IEEE Transactions on Power Systems, vol. 26, (4), pp. 1875-1184, 2011. [3] J. Slootweg, H. Polinder, W. Kling, "Dynamic Modelling of a Wind Turbine with Doubly Fed Induction Generator," P Proc. IEEE PowerEng. Soc. Summer Meeting, Vancouver, BC, Canada, July 15-19, 2001. Figure 3. Blue points represent the variation reduction the convex optimization procedure produces. Magenta shows the further reduction when the output is targeted by one hour intervals. . [4] J. Manwell, J. McGowan, A. Rogers, "Aerodynamics of Wind Turbines," Wind Energy Explained, 2nd ed. Chinchester, United Kingdom: Wiley, 2010. [5] S. Boyd and L. Vandenberghe, Convex Optimization, Cambridge: Cambridge University Press, 2004.


