Preliminary Estimate of Cost Savings in NPCC System With Wind... Noha Abdel-Karim and Marija Ilić, 4
advertisement
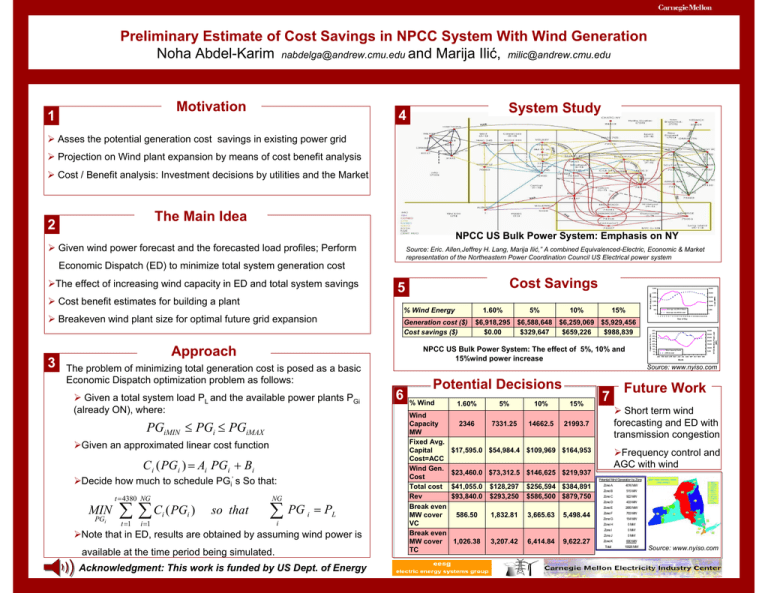
Preliminary Estimate of Cost Savings in NPCC System With Wind Generation Noha Abdel-Karim nabdelga@andrew.cmu.edu and Marija Ilić, milic@andrew.cmu.edu Motivation 1 System Study 4 ¾ Asses the potential generation cost savings in existing power grid ¾ Projection on Wind plant expansion by means of cost benefit analysis ¾ Cost / Benefit analysis: Investment decisions by utilities and the Market The Main Idea 2 NPCC US Bulk Power System: Emphasis on NY ¾ Given wind power forecast and the forecasted load profiles; Perform Cost Savings 5 ¾ Cost benefit estimates for building a plant % Wind Energy ¾ Breakeven wind plant size for optimal future grid expansion 3 ¾Given an approximated linear cost function C i ( PGi ) = Ai PGi + Bi ¾Decide how much to schedule PGi’ s So that: t = 4380 NG MIN PGi ∑ t =1 ∑ Ci ( PGi ) i =1 NG so that ∑ PG i = PL i ¾Note that in ED, results are obtained by assuming wind power is available at the time period being simulated. Acknowledgment: This work is funded by US Dept. of Energy 10% 15% 30,000 2,500 25,000 2,000 20,000 1,500 15,000 1,000 500 10,000 Ave rage July Wind Output 5,000 Ave rage July NYCA Load 0 $6,918,295 $6,588,648 $0.00 $329,647 $6,259,069 $5,929,456 $659,226 $988,839 0 NPCC US Bulk Power System: The effect of 5%, 10% and 15%wind power increase Hour of Day 45% 35,000 40% 30,000 35% 25,000 30% 20,000 25% 20% 15,000 15% 10% 5% 10,000 Wind Capacity Factor 5,000 NYCA Load 0% NYCA Monthly Peak Load (MW) Generation cost ($) Cost savings ($) The problem of minimizing total generation cost is posed as a basic Economic Dispatch optimization problem as follows: PGiMIN ≤ PGi ≤ PGiMAX 5% 3,000 1 2 3 4 5 6 7 8 9 10 11 12 13 14 15 16 17 18 19 20 21 22 23 24 Approach ¾ Given a total system load PL and the available power plants PGi (already ON), where: 1.60% Capacity Factor (%) ¾The effect of increasing wind capacity in ED and total system savings Wind Output (MW) Economic Dispatch (ED) to minimize total system generation cost Load (MW) Source: Eric. Allen,Jeffrey H. Lang, Marija Ilić,” A combined Equivalenced-Electric, Economic & Market representation of the Northeastern Power Coordination Council US Electrical power system JAN FEB MAR APR MAY JUN JUL AUG SEP OCT NOV DEC Month Source: www.nyiso.com 6 Potential Decisions % Wind Wind Capacity MW Fixed Avg. Capital Cost=ACC Wind Gen. Cost Total cost Rev Break even MW cover VC Break even MW cover TC 1.60% 5% 10% 15% 2346 7331.25 14662.5 21993.7 7 Future Work ¾ Short term wind forecasting and ED with transmission congestion ¾Frequency control and AGC with wind $17,595.0 $54,984.4 $109,969 $164,953 $23,460.0 $73,312.5 $146,625 $219,937 Potential Wind Generation by Zone $41,055.0 $93,840.0 586.50 $128,297 $293,250 1,832.81 $256,594 $384,891 $586,500 $879,750 3,665.63 5,498.44 Zone A 4016 MW Zone B 515 MW Zone C 433 MW Zone E 2683 MW Zone F 703 MW Zone G 154 MW Zone H 0 MW Zone I 1,026.38 3,207.42 6,414.84 9,622.27 922 MW Zone D 0 MW Zone J 0 MW Zone K 600 MW Total 10026 MW Source: www.nyiso.com

