Number and Percent of Public Schools in North Carolina
advertisement
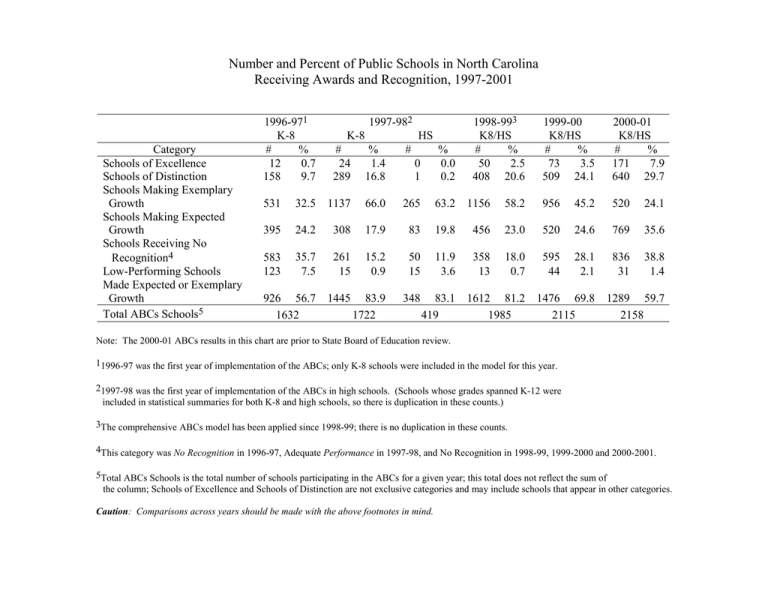
Number and Percent of Public Schools in North Carolina Receiving Awards and Recognition, 1997-2001 Category Schools of Excellence Schools of Distinction Schools Making Exemplary Growth Schools Making Expected Growth Schools Receiving No Recognition4 Low-Performing Schools Made Expected or Exemplary Growth Total ABCs Schools5 1996-971 K-8 # % 12 0.7 158 9.7 1997-982 K-8 HS # 24 289 % 1.4 16.8 # 0 1 % 0.0 0.2 1998-993 K8/HS # % 50 2.5 408 20.6 1999-003 K8/HS # % 73 3.5 509 24.1 2000-013 K8/HS # % 171 7.9 640 29.7 531 32.5 1137 66.0 265 63.2 1156 58.2 956 45.2 520 24.1 395 24.2 308 17.9 83 19.8 456 23.0 520 24.6 769 35.6 583 123 35.7 7.5 261 15 15.2 0.9 50 15 11.9 3.6 358 13 18.0 0.7 595 44 28.1 2.1 836 31 38.8 1.4 926 56.7 16321 1445 83.9 17221 348 83.1 4191 1612 81.2 19851 1476 69.8 21151 1289 59.7 21581 Note: The 2000-01 ABCs results in this chart are prior to State Board of Education review. 11996-97 was the first year of implementation of the ABCs; only K-8 schools were included in the model for this year. 21997-98 was the first year of implementation of the ABCs in high schools. (Schools whose grades spanned K-12 were included in statistical summaries for both K-8 and high schools, so there is duplication in these counts.) 3The comprehensive ABCs model has been applied since 1998-99; there is no duplication in these counts. 4This category was No Recognition in 1996-97, Adequate Performance in 1997-98, and No Recognition in 1998-99, 1999-2000 and 2000-2001. 5Total ABCs Schools is the total number of schools participating in the ABCs for a given year; this total does not reflect the sum of the column; Schools of Excellence and Schools of Distinction are not exclusive categories and may include schools that appear in other categories. Caution: Comparisons across years should be made with the above footnotes in mind.
