vn cL x s b
advertisement
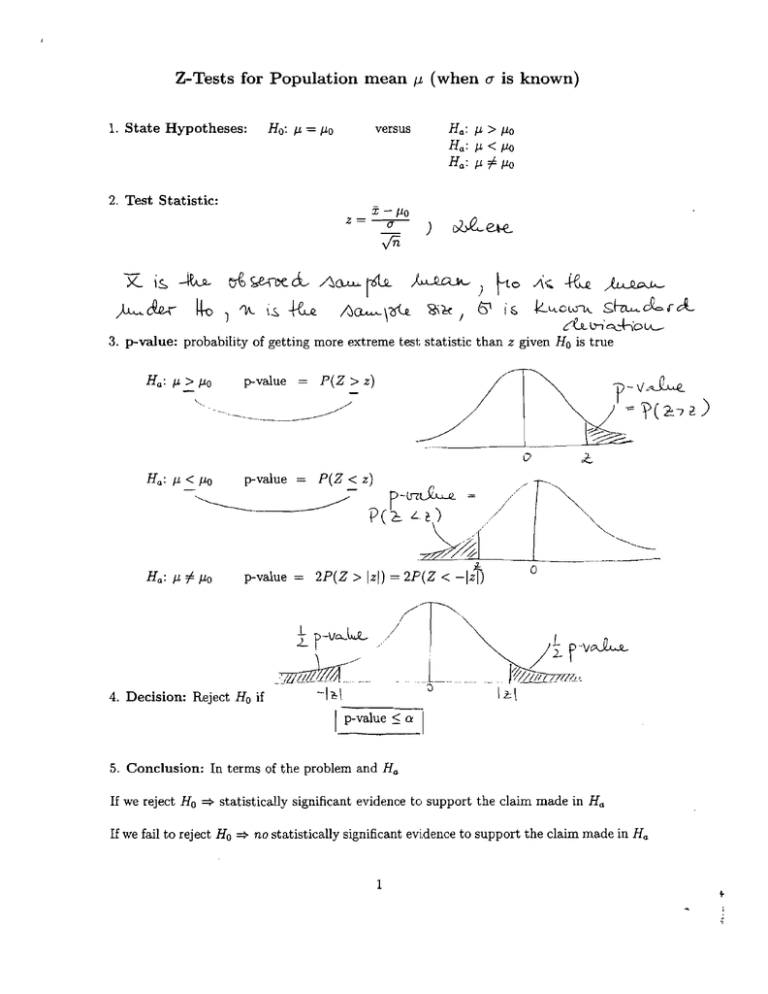
Z-Tests for Population mean I), (when
1. State Hypotheses:
Ho:!-t = !-to
x -!-to
z= -(]'­
)
vn
(J{ ~CL ~(J...Lu. ~
) '1A.
\.s.·feu
is known)
H a : !-t > !-to
H a : !-t < !-to
Ha : !-t i=!-to
versus
2. Test Statistic:
(J
)~} ~o /\~~~
10(l..u..... \ole. '2\1<
J
6' i i;
K-L<.CLSlA.
s b cL or c:l.
d.t. Ln'~-hOlA-
3. p-value: probability of getting more extreme test statistic than z given H o is true
p-value =
P(Z > z)
y-v.~
= 'V(2:.7 2)
o
o
p-value =
±p-vo..L.L
4. Decision: Reject H o if
-~~-I~\
I p-value
~a
5. Conclusion: In terms of the problem and H a
If we reject H o :;. statistically significant evidence to support the claim made in H a
If we fail to reject H o :;. no statistically significant evidence to support the claim made in H a
1
EXAMPLES FOR TESTING A POPULATION MEAN J.L, WHEN
(J
IS KNOWN
(z - procedure)
EXAMPLE
1:
Developing a new diet (to lose weight) and measure the # of Ibs lost. Took a random sample
of 36 people on the diet and found the average # of pounds lost to be 2.5 Ibs. From past
experience we know the population standard deviation to be 6 Ibs. Is the diet effective?
Conduct a test at the a = 0.01 level of significance.
1. State the null and alternative hypotheses:
vs
o
2. Compute the value of the test statistic:
=-­
3. Find the p-value associated with the test statistic:
r-
GCLL
=f ( 2 /
Z. ') -=
=-1- 1>( ~
L
= \- . '1433
4. Decision:
'P (i. ) 2- .S')
e2 5)
= O.OOb2.
~ e d t+-o i.~ P-VC1-k
.0, 0062...
0.0 1
L
....:~::::.-='''+-'----- evidence (at the a = 0.01 level) to
-'=.:....:::.;::..:....c=.!...'-==+---""--""Il-=-''+'.
weight loss is greater than zero.
2
+
EXAMPLE
2:
A researcher believes that the mean score J.L of all third graders in a district is lower than the
national mean, which is 32. We know the scores are approximately normal with population
standard deviation of 11 for this school district. lest the claim of the researcher at the
a = 0.05 level, using a random sample of 44 students in which the sample mean is 28.91.
1. State the null and alternative hypotheses:
2. Compute the value of the test statistic:
l.&b
3. Find the p-value associated with the test statistic:
p-~
-=f(c
'Pet:
:=
-:::
i::)
L
/
L
.~-'
-I,gb)
O,O~l+
-----'---­
-I.~b
4. Decision:
~eJ
'tt
o.O~ \ 4-
r'-\r~
L.
\X~
L
OOS
0.05
~=-=.~
evidence (at the a = 0.05 level)
aders in this district is less than 32 (National
-=-'--=-'=--'--==-'-.:....::...::.....;"'-+-----"''---H=-'+--'--.
':fo~) -~ ~Jet ~0+ ~ ~Qcke::t ~
bet CX- ~ 0.0 t \j
3
r-~ I o(~ 0.01
. 9 -pl -to l4ecJ
EXAMPLE
3:
A manufacturer of a sprinkler system used for fire protection in office buildings claims that
the true average system-activation temperature is 130c P. A random sample of n = 9 systems
when tested yielded a sample mean activation temperature of 131.08° F. If the distribution
of activation temperatures is normal with (T = 1.5° F, does the data contradict the manufac­
turer's claim at the 0.01 significance level?
1. State the null and alternative hypotheses:
Vs­
2. Compute the value of the test statistic:
l~l.o~:
- \6'0
1'~/f<11
3. Find the p-value associated with the test statistic:
- c2. i> (t:
= c2. r( t:
4. Decision:
L. - \
L. -
~I )
02 .16)
;). O.O\szt­
0.0308
--"--'~.!:!..l.=l...l:'-J....!..:=~1---'~~~4-l-'~<Gw=./~
5. There is
average activation temperature di
evidence to conclude that the true
the design value of 130°F.
4
