The Design of an FAA Campus Motor Fleet Decision Support System
advertisement

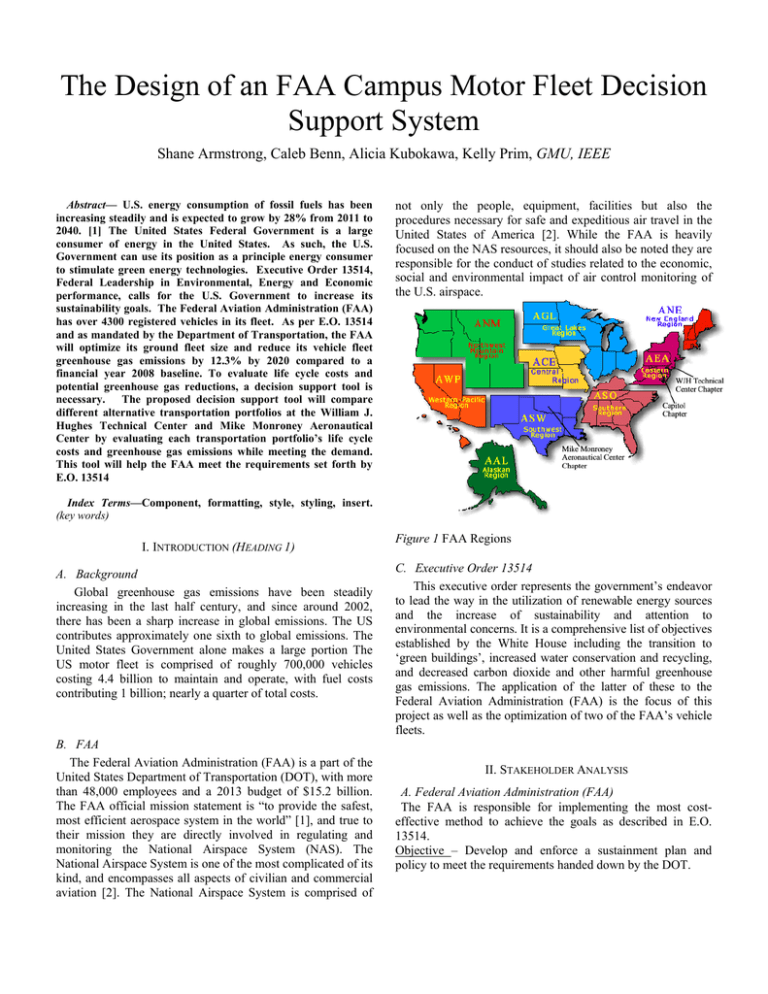
The Design of an FAA Campus Motor Fleet Decision Support System Shane Armstrong, Caleb Benn, Alicia Kubokawa, Kelly Prim, GMU, IEEE Abstract— U.S. energy consumption of fossil fuels has been increasing steadily and is expected to grow by 28% from 2011 to 2040. [1] The United States Federal Government is a large consumer of energy in the United States. As such, the U.S. Government can use its position as a principle energy consumer to stimulate green energy technologies. Executive Order 13514, Federal Leadership in Environmental, Energy and Economic performance, calls for the U.S. Government to increase its sustainability goals. The Federal Aviation Administration (FAA) has over 4300 registered vehicles in its fleet. As per E.O. 13514 and as mandated by the Department of Transportation, the FAA will optimize its ground fleet size and reduce its vehicle fleet greenhouse gas emissions by 12.3% by 2020 compared to a financial year 2008 baseline. To evaluate life cycle costs and potential greenhouse gas reductions, a decision support tool is necessary. The proposed decision support tool will compare different alternative transportation portfolios at the William J. Hughes Technical Center and Mike Monroney Aeronautical Center by evaluating each transportation portfolio’s life cycle costs and greenhouse gas emissions while meeting the demand. This tool will help the FAA meet the requirements set forth by E.O. 13514 not only the people, equipment, facilities but also the procedures necessary for safe and expeditious air travel in the United States of America [2]. While the FAA is heavily focused on the NAS resources, it should also be noted they are responsible for the conduct of studies related to the economic, social and environmental impact of air control monitoring of the U.S. airspace. Index Terms—Component, formatting, style, styling, insert. (key words) I. INTRODUCTION (HEADING 1) A. Background Global greenhouse gas emissions have been steadily increasing in the last half century, and since around 2002, there has been a sharp increase in global emissions. The US contributes approximately one sixth to global emissions. The United States Government alone makes a large portion The US motor fleet is comprised of roughly 700,000 vehicles costing 4.4 billion to maintain and operate, with fuel costs contributing 1 billion; nearly a quarter of total costs. B. FAA The Federal Aviation Administration (FAA) is a part of the United States Department of Transportation (DOT), with more than 48,000 employees and a 2013 budget of $15.2 billion. The FAA official mission statement is “to provide the safest, most efficient aerospace system in the world” [1], and true to their mission they are directly involved in regulating and monitoring the National Airspace System (NAS). The National Airspace System is one of the most complicated of its kind, and encompasses all aspects of civilian and commercial aviation [2]. The National Airspace System is comprised of Figure 1 FAA Regions C. Executive Order 13514 This executive order represents the government’s endeavor to lead the way in the utilization of renewable energy sources and the increase of sustainability and attention to environmental concerns. It is a comprehensive list of objectives established by the White House including the transition to ‘green buildings’, increased water conservation and recycling, and decreased carbon dioxide and other harmful greenhouse gas emissions. The application of the latter of these to the Federal Aviation Administration (FAA) is the focus of this project as well as the optimization of two of the FAA’s vehicle fleets. II. STAKEHOLDER ANALYSIS A. Federal Aviation Administration (FAA) The FAA is responsible for implementing the most costeffective method to achieve the goals as described in E.O. 13514. Objective – Develop and enforce a sustainment plan and policy to meet the requirements handed down by the DOT. Tension – The requirements are in addition to the FAA’s mission of aviation safety and must be met using existing resources. B. Fleet Managers There are fleet managers at each of the operational centers who oversee the motor fleet inventory. The fleet manager will allocate vehicles to each charge group based on need and handles any issues with the inventory such as not having an available vehicle. Objective – Continue to meet transportation demand while keeping costs low. Tension – Decreased fleet inventory may complicate allocation of vehicles. C. Vehicle Users The staff that will use the replacement vehicles on a dayto-day basis will be concerned with the new vehicle’s capabilities and will be directly affected by the replacement vehicles. Whether or not the vehicles emit more or less GHG’s is likely of secondary concern. highlighted by the 2013 government shutdown, a consistent budget is necessary. By reducing the impact of highly variable costs of gas prices and making them fixed or lowering the impact of their volatility, the FAA will benefit from stable costs. The focus of this project is the reduction of the carbon dioxide emissions at the Mike Monroney Aeronautical Center and William J. Hughes Technical Center of the FAA, in accordance with E.O. 13514, while meeting and maintaining travel demand and receiving no additional funding. If the current path is maintained, the FAA will not meet the mandates of E.O. 13514. B. Need Statement The ALO needs a process to analyze Life Cycle Costs of current vehicle fleets versus alternative transportation methods applicable to its two main campuses and by extension other secure facilities. The proposed process will be applied to reduce the vehicle fleet petroleum consumption and carbon dioxide emissions. Implementation of these transportation alternatives will assist the FAA in meeting the mandates of Executive Order 13514. Objective – Use vehicles to accomplish work responsibilities more efficiently. IV. DESIGN ALTERNATIVES Tension – Alternative transportation systems may present a change in the way in which job related tasks are completed. D. Council on Environmental Quality Chair and Office of Management and Budget Director The duties of the CEQ Chair and OMB Director are essentially oversight; making sure the proper progress is being made by the FAA and creating scorecards for their progress through goals and metrics. Also, they are responsible for creating the Steering Committee on Federal Sustainability. Objective – To establish targets and track, verify, and grade the progress of federal departments towards the requirements mandated by E.O. 13514. Tension – Targets can be a challenge to meet. III. PROBLEM AND NEED STATEMENTS A. Problem Statement The President has issued Executive Order 13514 mandating that government agencies reduce their petroleum fuel consumption, increase alternative fuel consumption, and optimize their vehicle fleet size. The FAA must reduce its vehicle fleet greenhouse gas emissions to meet the executive order. The Aviation Logistics Organization is in charge of meeting this objective. In order to reach this goal, alternative forms of transportation are being considered as replacements/substitutions for current fleet inventory. As is The following figures have the considered alternatives. A. Status Quo The status quo is the current inventory without changes. It is capable of meeting demand, but not the sustainment goals set out by the Department of Transportation derived from Executive Order 13514. B. LSEVs Low speed electric vehicles (LSEVs) are battery powered vehicles capable of 25 mph. They do not require registration when purchased due to their restricted top speeds. LSEVs emit zero direct emissions and are currently in use at the FAA operational campuses. C. NEVs Neighborhood electric vehicles (NEVs) are battery powered vehicles capable of speeds greater than 25 mph. Unlike LSEVs they require registration when purchased. D. CNGVs Compressed natural gas vehicles (CNGVs) are a combustion powered vehicle and use the same technology as current gasoline powered vehicles, with a different fuel source. Gasoline vehicles can be modified to use compressed natural gas. Natural Gas is produced domestically as opposed to oil with is primary imported. The combustion of natural gas results in approximately 30% fewer carbon dioxide emissions than gasoline. Figure 2 Simulation flow diagram Table 1 Design alternatives selected for simulation Table 2 Total design alternatives considered V. METHOD OF ANALYSIS A. Simulation The proposed model will take data given regarding the Mike Monroney Aeronautical Center and the William J. Hughes Technical Center to simulate the demand of the two campuses. The demand analysis will be used to calculate the inventory necessary to meet the demand of the campuses. The demand analysis will output the inventory and the energy consumed to meet the demand. The LCC costs of the portfolio will then be calculated through a deterministic and stochastic life cycle cost models. The individual portfolios will then be weighed against each other based upon their cost, CO2 emissions, and inventory size. Figures 19 and 20 show the null and alternate hypotheses for our simulation. The flow diagram for the entire simulation through all phases can be seen in the figure below. B. Design of Experiment In order to determine the best alternative for reducing CO2 emissions by optimizing fleet inventory, we will simulate one year of campus events requiring the use of operational and administrative fleet vehicles. The output will be the number of vehicles needed in fleet inventory to meet demand on the campuses. A buffer will also be added to the demand to ensure vehicles within the alternatives will be able to meet fluctuations. The results of this experiment will be used to determine the best alternative for fleet optimization and reducing CO2 emissions based on requirements. The life cycle cost models will also be used as part of the decision making process by comparing costs against utility. Assumptions will be used as necessary to complete the model. The demand model will use historic campus data and current vehicle inventory as inputs along with the expected value of the yearly demand for the motor fleet of each campus. The demand model will output the required number of vehicles to meet demand for each alternative portfolio as well as the CO2 emissions calculated for each portfolio. The status quo will output the current inventory of vehicles and the yearly CO2 emissions as shown in Figure 22. Figure 23 shows the inputs and outputs of each of the life cycle cost models that will be applied to each portfolio and status quo scenarios. C. Phase 1 Phase I is the demand model which will generate events for each campus in order to simulate the demand for the vehicle fleet and determine how many vehicles are needed to meet the current demand. These events will be based on the number of trips, passengers, distance, time of use, and load capacity. A comparator will be used to determine if the fleet size and CO2 emissions have been reduced for each alternative. D. Phase 2 The second phase is the deterministic life cycle cost model. Phase II will calculate the life cycle costs for each alternative based on the cost analysis conducted for each component of the system. The life cycle cost equation will be a summation of acquisition cost, maintenance costs, and energy costs. For any alternative that is eligible for incentives, this benefit will be subtracted from the acquisition cost. E. Phase 3 Phase III will use a stochastic model to project life cycle costs through 2020. The model will use projections for energy costs, and projected trends for the remaining costs of the life cycle cost equation. The projected costs will be applied to increases or decreases in projected fleet inventory based on demand. C acq n n n C ma int C ener t t t t 1 (1 d ) t 1 (1 d ) t 1 (1 d ) VI. RESULTS TBD VII. RECOMMENDATIONS AND CONCLUSIONS Although we do not have results from our models as of yet, a few preliminary recommendations can be made based on our analysis and research: 1. Utilize Video Teleconference and Teleworking resources when appropriate. 2. Centralize motor pool 3. Keep track of individual usage a. Trip time b. Trip length c. Reason for vehicle 4. Use LSEV’s in place of administrative vehicles with terrain and weather permitting. (tentative) 5. Use LSEV’s in place of operational vehicles carrying loads weighing no more than YY lbs. (tentative) ACKNOWLEDGMENT We wish to acknowledge the special contributions of Mrs. Paula Lewis, Ms. Karen Kirk, Ms. Laura Sullivan, Dr. Lance Sherry, Dr. Peggy Brouse, Dr. Jie Xu, Dr. Rajesh Ganesan, and Dr. Karla Hoffman. REFERENCES [1] J. Russel. “Career Coach: The pros and cons of telecommuting”. http://articles.washingtonpost.com/2013-0324/business/37989930_1_new-employees-cost-savingsretention-of-talented-employees. March 24, 2013. [2] “The natural-gas alternative: The pros & cons of buying a CNGpowered car”. http://www.consumerreports.org/cro/2012/03/thenatural-gas-alternative/index.htm. March 2012. [3] “High-mpg cars: Pros and Cons”. http://www.telegram.com/article/20130716/COLUMN83/30716 9973/1011. July 16, 2013. [4] “Climate Change Indicators in the United States”. http://www.epa.gov/climatechange/science/indicators/ghg/global -ghg-emissions.html. 2012 [5] “Climate Change Indicators in the United States”. http://www.epa.gov/climatechange/science/indicators/ghg/usghg-emissions.html. 2012 [6] “How much gasoline does the United States consume?”. http://www.eia.gov/tools/faqs/faq.cfm?id=23&t=10. July 18, 2012. [7] “U.S. and World Population Clock”. http://www.census.gov/popclock/. Dec. 2012. [8] “Executive Order 13514”. http://www1.eere.energy.gov/femp/regulations/eo13514.html#ft m. July 8, 2012. [9] “How many alternative fuel and hybrid vehicles are there in the U.S.?”. http://www.eia.gov/tools/faqs/faq.cfm?id=93&t=4. [10] “Pros and Cons of Electric Bikes”. http://www.ecowheelz.com/articles/pros-and-cons-of-electric-bikes.php. 2012 [11] “NASA Finds 2011 Ninth-Warmest Year on Record”. http://www.nasa.gov/topics/earth/features/2011-temps.html. Jan 19, 2012. [12] Ujwal Deshmukh. “Hydrogen Cars Pros and Cons”. http://www.buzzle.com/articles/hydrogen-cars-pros-andcons.html. March 1, 2012. [13] U.S. Department of Energy. “Guidance for the Implementation and Follow-up of Identified Energy and Water Efficiency Measures in Covered Facilities”. https://www1.eere.energy.gov/femp/pdfs/lcc_guide_05.pdf. September 2012


