Behavioral Ecology Vol. 15 No. 3: 433–437
DOI: 10.1093/beheco/arh031
Rodent foraging is affected by indirect,
but not by direct, cues of predation risk
John L. Orrock,a Brent J. Danielson,a and R. Jory Brinkerhoffb
Ecology and Evolutionary Biology Interdepartmental Graduate Program, Iowa State University,
Ames, IA 50011, USA, and bDepartment of Zoology, North Carolina State University,
Raleigh, NC 27695, USA
a
We used foraging trays to determine whether oldfield mice, Peromyscus polionotus, altered foraging in response to direct cues of
predation risk (urine of native and nonnative predators) and indirect cues of predation risk (foraging microhabitat,
precipitation, and moon illumination). The proportion of seeds remaining in each tray (a measure of the giving-up density
[GUD]) was used to measure risk perceived by mice. Mice did not alter their GUD when presented with cues of native predators
(bobcats, Lynx rufus, and red foxes, Vulpes vulpes), recently introduced predators (coyotes, Canis latrans), nonnative predators
(ocelots, Leopardus pardalis), a native herbivore (white-tailed deer, Odocoileus virginianus), or a water control. Rather, GUD was
related to microhabitat: rodents removed more seeds from foraging trays sheltered beneath vegetative cover compared with
exposed trays outside of cover. Rodents also removed more seeds during nights with precipitation and when moon illumination
was low. Our results suggest that P. polionotus used indirect cues rather than direct cues to assess risk of vertebrate predation.
Indirect cues may be more reliable than are direct scent cues for estimating risk from multiple vertebrate predators that present
the most risk in open environments. Key words: foraging, giving-up densities, Peromyscus polionotus; predator recognition; prey
behavior; risk assessment; Savannah River Site. [Behav Ecol 15:433–437 (2004)]
ntipredator behavior can affect the fitness of individuals
(Curio, 1993; Lima, 1998a,b; Lima and Dill, 1990) and the
dynamics of populations (Brown et al., 1999; Lima, 1998a).
Although evidence suggests that prey can detect cues of
different predators and respond accordingly (see Curio, 1993;
Kats and Dill, 1997; Kotler et al., 1991; Lima, 1998b), little is
known about whether predator-specific risk assessment and
response are common among prey, or if prey use simpler
‘‘rules of thumb’’ to avoid risk (Bouskila and Blumstein,
1992). Understanding how prey assess and respond to risk
may provide insight into how predation risk affects the
structure of ecological communities (Brown et al., 1999;
Kotler, 1984; Schmitz et al., 1997), including decimation of
prey by introduced predators (Williamson, 1996) and the
reintroduction of rare species (Blumstein et al., 2000; Griffin
et al., 2000).
Rodents are prey for avian, reptilian, and mammalian
predators. Evidence suggests that rodents alter their foraging
in risky situations. For example, rodents preferentially forage
in sheltered microhabitats (often under vegetative cover),
where the risk of avian predation is lower (see Kotler et al.,
1991). Foraging may be greater when precipitation or lack of
moonlight reduces the ability of vertebrate predators to detect
and capture rodents (King, 1968; Kotler et al., 1991). Rodents
may also avoid forest edges, where vertebrate predation risk is
greater (Morris and Davidson, 2000), or forage more intensively close to refuges and escape routes (Brown and
Morgan, 1995; Thorson et al., 1998). The robustness of this
pattern suggests that mice alter their foraging in different
microhabitats by using indirect cues (dangerous microhabitats) rather than direct cues (a cue produced by the
predator, such as urine or sound). As such, mice may use a
simple rule of thumb to moderate antipredator behavior: avoid
dangerous places.
A
Address correspondence to J. L. Orrock. E-mail: jorrock@iastate.edu.
Received 13 December 2002; revised 25 April 2003; accepted 7 July
2003.
However, whether a place is dangerous may depend upon
the presence of a particular predator. Foraging by oldfield
mice, Peromyscus polionotus, was reduced in experimental
patches where bobcat (Lynx rufus) urine was added compared
with patches with no urine addition (Brinkerhoff RJ, unpublished data). Rodents are at risk of avian predation in
exposed microhabitats but are more susceptible to predation
by snakes in sheltered microhabitats (Bouskila, 1995; Kotler et
al., 1991; Kotler et al., 1993). At least one species of desert
rodent can discriminate among avian predators and alters its
behavior accordingly (Kotler et al., 1991). Similarly, fox
squirrels (Sciurus niger) and 13-lined ground squirrels (Spermophilus tridecemlineatus) alter foraging in the presence of a plastic
owl model but not in the presence of red fox (Vulpes vulpes)
urine (Thorson et al., 1998). Rodents may respond to predator
urine in a general fashion, using sulfur compounds as an
indicator of the amount of meat in a predator’s diet (Nolte et
al., 1994). Alternatively, rodents may exhibit predator-specific
responses, behaving differently in the presence of odors from
different terrestrial predators (Jedrzejewski et al., 1993).
Our first objective was to examine the importance of indirect
cues of predation risk (e.g., exposed or sheltered microhabitats) compared with direct cues (predator urine). Our
second objective was to examine whether rodents recognize
specific terrestrial predator types (e.g., discriminating between
bobcats and red foxes), which would be advantageous if
predators differ in their impact on rodent fitness. In addition
to using urine of native predators, we also tested urine of
predators that have recently (within 30 years) become
sympatric with rodents and those that have never been
sympatric with rodents.
Prey may respond to predation risk by exhibiting a shortterm reduction in foraging that can only be sustained for
a short time before other constraints (e.g., hunger) make it
necessary to resume foraging activity (Lima and Bednekoff,
1999). As such, short-lived field studies that manipulate risk
may overestimate the perception of risk by prey and may not be
indicative of prey responses over more reasonable time spans,
in which prey must balance predation risk with other activities
Behavioral Ecology vol. 15 no. 3 International Society for Behavioral Ecology 2004; all rights reserved.
Behavioral Ecology Vol. 15 No. 3
434
(e.g., food and mate acquisition; Lima and Bednekoff, 1999).
To examine this possibility, our third objective was to determine if mice became less responsive to our experimentally
manipulated predator cues as the experiment progressed. If so,
this should be evident as a significant time and a significant
predator cue effect if mice respond to all predator cues, or
a significant time by predator cue interaction if mice respond
to some predator cues.
METHODS
Study location and study species
Our study was conducted from 19 May–24 July 2001 in an earlysuccessional field at the Savannah River Site, a National
Environmental Research Park (NERP) near Aiken, South
Carolina. The field was planted with Longleaf Pine (Pinus
palustris) in 1998 and also contained early-successional plants
such as pokeweed (Phytolacca americana), partridge pea
(Chamaecrista fasciculata), Lespedeza spp., and blackberry (Rubus
spp.). The study area represents high-quality habitat for the
oldfield mouse, P. polionotus (Cothran et al., 1991). P. polionotus
has a limited geographic range that extends along coastal
regions from Florida north to central South Carolina, and west
to portions of Alabama (Hall, 1981; King, 1968).
Historically, the range of P. polionotus has overlapped with
that of bobcats, L. rufus, and red foxes, V. vulpes (King, 1968;
Larivière and Pasitschniak-Arts, 1996; Larivière and Walton,
1997). Coyotes, C. latrans, recently expanded their geographic
range and were first documented at our study area in 1989
(Cothran et al., 1991). Ocelots, Leopardus pardalis, are predators
that have never been present in the study area (Hall, 1981).
All of these predators are known to prey upon mice,
although rodents are more frequent in the diet of V. vulpes
compared with L. rufus and C. latrans, which both prey more
frequently upon rabbits and larger rodents (Bekoff, 1977;
Larivière and Pasitschniak-Arts, 1996; Larivière and Walton,
1997; Major and Sherburne, 1987). Based upon predator diet,
if P. polionotus can discriminate among cues of all predator
types, foraging activity should be ranked (from least to
greatest): V. vulpes , L. rufus L. pardalis , C. latrans.
However, V. vulpes may not be locally abundant in the study
area, whereas C. latrans populations are probably still rising
(Weston, 2002). Because local density and activity of predators
are not known and predator efficiency and diet are unlikely to
be constant in time, our prediction is necessarily subjective.
Experimental design
We used predator urine as a cue to suggest the presence of each
predator type. Olfactory predator cues are known to affect the
behavior of a variety of organisms (Kats and Dill, 1997),
including P. polionotus (Brinkerhoff RJ, unpublished data),
Peromyscus spp. (Nolte et al., 1994), and other rodents (see
Jedrzejewski et al., 1993; Kats and Dill, 1997; Sullivan et al.,
1988; Swihart, 1991). In addition to four types of predator
urine, urine of white-tailed deer, Odocoileus virginianus, was
used as a urine control, and water was used as a nonurine
control. We obtained C. latrans, V. vulpes, L. rufus, and O.
virginianus urine from commercial suppliers (Buckeye Scent
Company and Leg Up Enterprises). Urine of L. pardalis was
obtained from an adult male ocelot housed at Wildlife on Easy
Street.
To measure the risk perceived by P. polionotus while foraging,
we used foraging trays with a known amount of seeds
thoroughly mixed with a homogenous substrate (sand). As
a foraging rodent depletes the seeds, diminishing returns are
realized (Brown, 1988; Morris and Davidson, 2000). At some
point the benefits of continued foraging are outweighed by the
costs, including the risk of predation (Brown, 1988). This
threshold, called the giving-up density (GUD; Brown, 1988)
represents a quantitative measure of perceived predation risk if
everything else experienced by the forager among treatments
can be assumed to be equal (Brown, 1988) and has been used
to quantify predation risk experienced by rodents (see
Bouskila, 1995; Herman and Valone, 2000; Kotler et al., 1991;
Morris and Davidson, 2000; Thorson et al., 1998).
Within the old field, we established nine sites, each
consisting of two foraging trays located in a different microhabitat. One tray was sheltered, positioned under vegetative
cover (e.g., a shrub or small tree). The corresponding tray was
exposed, placed outside of cover, less than 1 m away. Each tray
was a 27 3 27 3 11-cm plastic storage container filled with 1 l of
sand. A 2.5-cm-diameter hole was drilled in each of two
adjacent sides. A constant volume of millet seeds representing
2.62 g 6 0.08 SE (N ¼ 40 samples) was added to each tray. GUD
was determined by weighing remaining seeds after removal of
seed hulls and debris and is expressed as the proportion of
seeds remaining. Seeds were dried for 5 h at 60 C before
weighing.
At each site, we applied 12 drops of one of six treatments
(water or urine of L. rufus, L. pardalis, C. latrans, V. vulpes, or O.
virginianus) each day by using a scent dispenser attached to
a wire pin flag 4–5 cm from the openings of each seed tray in
each microhabitat (sheltered and exposed). Scent dispensers
consisted of a cotton ball within a plastic film can with V-shaped
slots cut into two sides to allow airflow. Each day, we visited all
trays and recorded signs of foraging activity (e.g., fecal pellets,
tracks, seed hulls). Seeds were sieved from each tray, and the
tray was charged with new seeds, which were thoroughly mixed
into the sand. Old scent dispensers were removed and replaced
with new scent dispensers, with a different scent as dictated by
the treatment design.
At least 3 days before beginning urine treatments, trays were
established and rodents allowed to forage in treatment-free
trays to become acclimated (Morris and Davidson, 2000). A
complete round of treatments was applied to six sites (12 trays)
from 19–24 May 2001. We added three more sites to the
experiment and applied treatments at all trays from 12–24 July
2001. Between the two rounds of the experiment, we
monitored trays each day but applied no scent treatments.
Data analysis
Our design represents a split-plot design (Littell et al., 1996).
Our data were slightly unbalanced because sites were removed
from the study if foraging activity ceased or trays became
occupied by fire ants, Solenopsis spp. (mean number of
complete rounds of urine treatments per site was 2.4 6 0.3
SE). The large experimental unit was the site, where different
treatments were applied to each site each day in a Latin square
design. Our design blocks for temporal variation owing to day,
as well as for repeated measures taken on each site (a cross-over
design; Littell et al., 1996). The smaller experimental unit was
the foraging trays themselves. At each site, one tray was
positioned under cover, and the corresponding tray was not
under cover. Moonlight (proportion of the moon illuminated)
was quantified each day with data from the US Naval
Observatory in Washington, DC, and the number of days that
the experiment had been conducted at a site was measured as
a covariate for each site. Days were also classified by the
occurrence of precipitation during nighttime hours at a rain
station 1.5 km from our study site.
Our mixed-model ANOVA (Littell et al., 1996) specified
time and site as random effects, predator scent and tray
location (covered or exposed) as fixed effects, precipitation as
Orrock et al.
•
Rodents and cues of predation risk
435
a fixed effect, and moon illumination as a covariate. The
number of days urine treatments had been run at a tray was
a covariate in our model to determine if risk-aversion
decreased with time (Lima and Bednekoff, 1999). If a significant urine treatment effect was found, we compared all
treatments in a pairwise fashion, using the Tukey-Kramer
adjustment for multiple comparisons (SAS, 2000).
We performed retrospective power analysis if we found no
significant difference among treatments for the main fixed
effects in our model to determine the effect sizes detectable by
our design (Thomas, 1997). We calculated the noncentrality
parameter for each effect by using the method and formulae of
Stroup (2002), and we used the observed variance from our
mixed-model analysis (Thomas, 1997). We use a two-tailed type
I error rate (alpha) of 0.05 for calculating power.
We performed our analyses using SAS Proc Mixed (SAS,
2000). The Satterthwaite method (Littell et al., 1996) was used
to generate the approximate denominator degrees of freedom
owing to the slightly unbalanced nature of our data. We
evaluated two- and three-way interactions and did not consider
them for inclusion in the final model unless they were
marginally significant (p , .15; Littell et al., 1996).
RESULTS
We examined 254 foraging observations taken from nine sites
over 19 days. Foraging activity was evident in 237 (93%) of the
observations and was independent of predator cue (v2 ¼ 1.06,
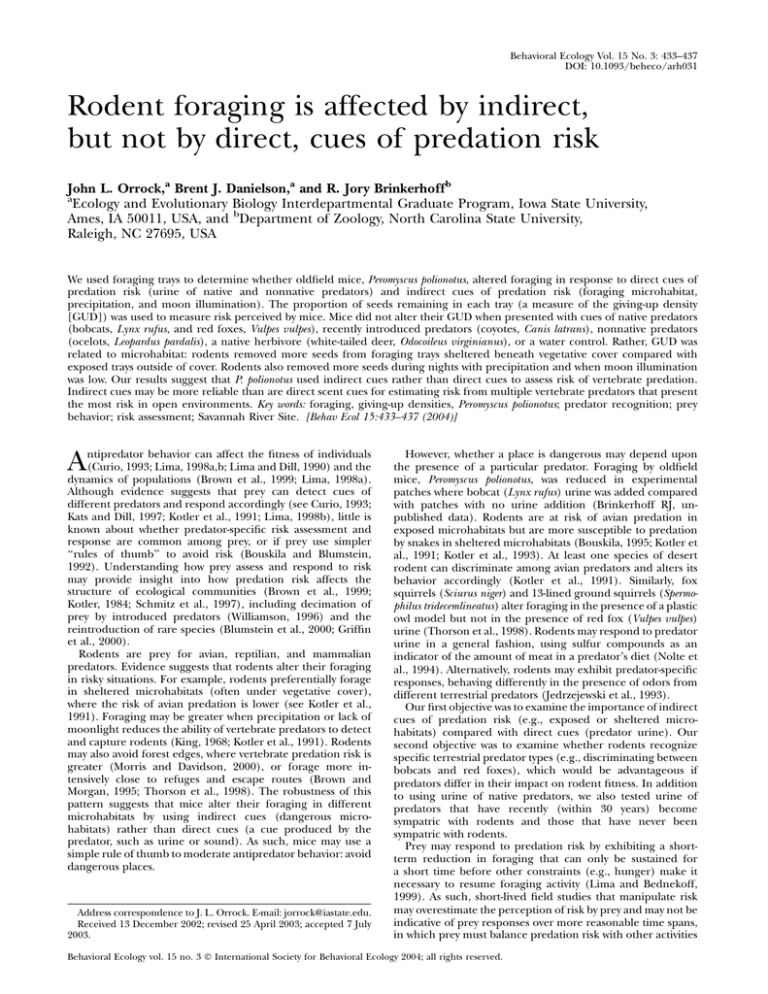
5 df, p ¼ .96). Seed removal by P. polionotus did not change in
response to vertebrate predator cues (F5,97.4 ¼ 0.69, p ¼ .63)
(Figure 1). Rather, P. polionotus altered foraging based on
microhabitat characteristics: rodents removed an average of
64% of seeds in covered trays compared with 55% of seeds
in exposed trays (F1,124 ¼ 23.10, p , .01) (Figure 1). Rodents
removed an average of 67% of seeds on nights with precipitation compared with 52% of seeds on nights without
precipitation (F1,15.8 ¼ 12.99, p , .01) (Figure 1). GUD increased as the proportion of the moon illuminated increased (F1,17.7 ¼ 11.33, p , .01; coefficient ¼ 0.23 6 0.07
SE). The duration of treatments at a site did not influence
GUD (F1,27.8 ¼ .43, p ¼ .50). There were no significant interactions (all p values . .20).
We estimated the effect size our study could have detected if
the response to urine only occurred to L. rufus, namely, as if all
other treatments were equal. We use this approach because
other research using L. rufus urine detected a reduction of seed
removal by P. polionotus (Brinkerhoff RJ, unpublished data),
suggesting that P. polionotus was capable of detecting and
responding to at least one of the urines we used. This approach
is conservative because power increases if a reduction in seed
removal of the same magnitude occurs in response to more
than one urine type (Quinn and Keough, 2002). Based upon
our sample sizes, we were able to detect a 45% change in
foraging with 80% power. This is well below the effect of L. rufus
urine found in our other work (foraging was 81% greater
when L. rufus urine was not present, paired t test, t ¼ 4.62, 2 df,
p ¼ .04; Brinkerhoff RJ, unpublished data).
To be sure that only P. polionotus was foraging in the trays, we
sampled our study area using Sherman Live Traps (Sherman
Traps). The first trapping session occurred from 15–18 May,
and the second session occurred from 8–14 August. P. polionotus
was the only species captured during these sessions; 13
individuals were captured during 360 trap-nights of sampling.
DISCUSSION
Rather than respond to direct predator-related cues, seed
removal by P. polionotus differed in response to indirect cues of
Figure 1
The mean proportion of seeds (6SE) left in foraging trays by
Peromyscus polionotus from 19 May–24 July 2002 at the Savannah River
Site. (a) There was no significant difference in the proportion of
seeds removed in response to the scent of native predators (B
indicates bobcats; F, foxes), recently introduced predators (C,
coyotes), nonnative predators (O, ocelots), a native herbivore (D,
white-tailed deer), and a control (W, water). (b) P. polionotus removed
significantly more seeds (p , .01) from trays located in microhabitats
sheltered beneath vegetative cover (sheltered) rather than adjacent
trays less than 1 m away in microhabitats that were not under cover
(exposed). (c) More seeds (p , .01) were removed from trays during
nights with precipitation compared with nights when no precipitation
occurred.
predation risk: moon illumination, precipitation, and whether
a foraging area was in an exposed or sheltered microhabitat.
These cues are likely to be effective because they convey
consistent information about risk from multiple predators. For
example, many of the predators at our study sites forage in
exposed habitats: owls, foxes, bobcats, and coyotes can all be
evaded if a rodent is close enough to cover. Thus, indirect cues
may be useful integrators of multiple risks; namely, distance
Behavioral Ecology Vol. 15 No. 3
436
from cover may provide more information about more
predators than does the scent cue of a particular predator.
Although there was no trend between foraging activity and the
duration of the experiment, we cannot evaluate whether risk
tolerance increased with the duration of the experiment
because P. polionotus did not respond to the risk we directly
manipulated; namely, there was no significant effect of time
and predator scent, and no significant predator scent by time
interaction.
There are three potential explanations for the lack of an
observed change in GUD in the presence of predator urine.
First, P. polionotus may have been unable to discriminate among
the scents used in the present study, either because P. polionotus
is incapable of discriminating among scents of predators, deer,
and water, or because the scents we used were not representative of the scents of predators and thus elicited no response.
There is ample evidence from laboratory and controlled field
settings that rodents can discriminate among predator scents
(see Herman and Valone, 2000; Jedrzejewski et al., 1993; Kats
and Dill, 1997; Parsons and Bondrup-Nielsen, 1996), including
L. rufus (Swihart, 1991), V. vulpes (Dickman, 1992; Rosell,
2001; Sullivan et al., 1988), and C. latrans (Nolte et al., 1994).
Moreover, in another study, we found that P. polionotus
removed fewer seeds in experimental landscapes where L.
rufus urine was applied over a 2-week period (Brinkerhoff RJ,
unpublished data). It is also likely that the urine we used was
capable of eliciting a response because predator urine was
obtained from animals fed a meat-rich diet, and the sulfur-rich
compounds present in the urine of carnivorous animals are
generally aversive to rodents (Nolte et al., 1994).
A second explanation for the lack of change in GUD in the
presence of predator urine is that our analysis lacked the
statistical power necessary to detect a biologically meaningful
effect size. Our retrospective power analysis suggests that our
study had 80% power to detect 45% change in seed removal
in response to just one of the six treatments. This change is
much smaller than the 81% effect size we noted when P.
polionotus was exposed to L. rufus urine in another experiment
(Brinkerhoff RJ, unpublished data). As such, it is not likely
that lack of power is responsible for the lack of a urine
treatment effect we observed.
A third explanation for the lack of change in GUD in the
presence of predator urine is that P. polionotus may be able to
discriminate among predator scents, but chooses not to alter
its foraging behavior. Under this scenario, discrimination is
possible, but the payoff of discrimination (the usefulness of
the information provided by the cue) may be outweighed by
opportunities missed during the act of discrimination (missedopportunity costs; Brown, 1988). Because discrimination
among predator scents is not likely to cost much in terms of
time (Jedrzejewski et al., 1993), it seems most likely that
predator urine provides low-quality information under the
field conditions of our study. This interpretation is in
agreement with other evidence that indirect cues are more
often used than are scent-based direct cues (Thorson et al.,
1998), evidence that responses to direct cues are weak
or transient (Herman and Valone, 2000; Parsons and
Bondrup-Nielsen, 1996), and studies that support the importance of microhabitat, illumination, and precipitation (see
Bowers et al., 1993; King 1968; Kotler et al., 1991; Morris and
Davidson, 2000; Thorson et al., 1998; Wolfe and Summerlin,
1989). In addition to reducing predation risk, precipitation
may also decrease foraging costs by increasing humidity,
making seeds easier for mice to locate (Vander Wall, 1995).
Our findings suggest that the amount of information
conveyed by a cue may be dependent upon its cost relative
to the quantity and quality of information already at hand
(Brown et al., 1999). For example, costs of reproduction may
explain why adult male bank voles respond to predator odors
but breeding females do not (Jedrzejewski and Jedrzejewska,
1990). Seasonal shifts in the effectiveness of predator urine
cues (Herman and Valone, 2000) provide more support that
the relative importance of direct and indirect cues is context
dependent. Other considerations, such as predator density,
foraging duration, spatial distribution, and whether the
presence of one predator type facilitates capture by another
predator type, could also affect the relative importance of
direct versus indirect cues (Brown et al., 1999). Direct cues
may become more important as evidence of predator
presence increases (Brown et al., 1999), presumably because
continued presence of scent is indicative of a resident, rather
than transient, predator. For example, R.J. Brinkerhoff
(unpublished data) found that P. polionotus did reduce
foraging activity in the presence of L. rufus urine, but urine
was presented for a longer duration than in the present study
(2 weeks). It is unclear how this may have impacted our
results, because a predator scent was present at each foraging
station during 67% of the treatments (four of the six
treatments were predator urine), and treatments were applied
for 1- and 2-week periods, but the type of urine was changed
each day of the study. Future work that examines the
importance of cue duration and consistency would be
a profitable next step in dissecting the relationship between
direct and indirect cues.
In conclusion, our work suggests that indirect cues may be
more useful than are direct cues for rodents that are consumed
by a variety of predators, probably because indirect cues
provide reliable, easily assessed information regarding the risk
from multiple predator types (Blumstein et al., 2000). From
a conservation perspective, this suggests that native prey may
not be affected by nonnative predators if the prey rely upon
indirect cues of risk that are effective against many predator
types. Our findings suggest that the effectiveness of using
predator scents to deter damage by rodents (Rosell, 2001;
Sullivan et al., 1988) may depend upon the ecological
circumstances under which the predator scent is applied
(Swihart, 1991). From an ecological perspective, our work
suggests that differences in rodent foraging behavior caused by
indirect cues of predation risk may reduce the impact of rodent
granivores on seed banks in exposed risky environments, and
may affect the structure and composition of rodent communities (Kotler, 1984).
Ocelot urine was kindly supplied by Jennifer Bush and Wildlife on Easy
Street, Tampa, FL. We appreciate the outstanding assistance of
Thaddeus Hunt, Daniel Kuefler, Molly Burns, Justin St. Juliana, Tamara
Barton, Morris Jones, Rob Fletcher, Les Murray, Jim Krenz, Ellen
Damschen, Ellie Koenig, and Julie Weston. The manuscript benefited
from the comments of N. Haddad, D. Morris, D. Westneat, and an
anonymous reviewer. Logistical support was also provided by John
Blake, Ed Olson, and other members of the U.S. Forest Service
Savannah River. Philip Dixon (Iowa State University) provided
statistical advice. Funding and support were provided by the Department of Energy–Savannah River Operations office through the US
Forest Service Savannah River under Interagency Agreement DE-IA0900SR22188. NSF grant DEB-9907365, a Grant in Aid of Research from
Sigma Xi to J.L.O., a Theodore Roosevelt Memorial Fund grant from
the American Museum of Natural History to J.L.O., and a Professional
Advancement Grant from Iowa State University to J.L.O. also made this
research possible.
REFERENCES
Bekoff M, 1977. Canis latrans. Mammal Species 79:1–9.
Blumstein DT, Daniel JC, Griffin AS, Evans CS, 2000. Insular tammar
wallabies (Macropus eugenii) respond to visual but not acoustic cues
from predators. Behav Ecol 115:28–535.
Orrock et al.
•
Rodents and cues of predation risk
Bouskila A, 1995. Interactions between predation risk and competition: a field study of kangaroo rats and snakes. Ecology 76:165–178.
Bouskila A, Blumstein DT, 1992. Rules of thumb for predation hazard
assessment: predictions from a dynamic model. Am Nat 139:161–
176.
Bowers MA, Jefferson JL, Kueber MG, 1993. Variation in giving-up
densities of foraging chipmunks (Tamias striatus) and squirrels
(Sciurus carolinensis). Oikos 66:229–236.
Brown JS, 1988. Patch use as an indicator of habitat preference,
predation risk, and competition. Behav Ecol Sociobiol 22:37–47.
Brown JS, Laundré JW, Gurung M, 1999. The ecology of fear: optimal
foraging, game theory, and trophic interactions. J Mammal 80:385–
399.
Brown JS, Morgan RA, 1995. Effects of foraging behavior and spatial
scale on diet selectivity: a test with fox squirrels. Oikos 74:122–136.
Cothran EG, Smith MH, Wolff JO, Gentry JB, 1991. Mammals of the
Savannah River Site. SRO-NERP-21. Aiken, South Carolina:
Savannah River Site.
Curio E, 1993. Proximate and developmental aspects of antipredator
behavior. Adv Study Behav 22:135–238.
Dickman CR, 1992. Predation and habitat shifts in the house mouse,
Mus domesticus. Ecology 73:313–322.
Griffin AS, Blumstein DT, Evans CS, 2000. Training captive-bred or
translocated animals to avoid predators. Conserv Biol 14:1317–1326.
Hall ER, 1981. The mammals of North America. New York: Wiley.
Herman CS, Valone TJ, 2000. The effect of mammalian predator scent
on the foraging behavior of Dipodomys merriami. Oikos 91:139–145.
Jedrzejewski W, Jedrzejewska B, 1990. Effect of a predator’s visit on the
spatial distribution of bank voles: experiment with weasels. Can J
Zool 68:660–666.
Jedrzejewski W, Rychlik L, Jedrzejewska B, 1993. Responses of bank
voles to odours of seven species of predators: experimental data and
their relevance to natural predator-vole relationships. Oikos 68:
251–257.
Kats LB, Dill LM, 1997. The scent of death: chemosensory assessment
of predation risk by prey animals. Écoscience 361–394.
King, JA, 1968. Biology of Peromyscus (Rodentia). Stillwater, Oklahoma: American Society of Mammalogists.
Kotler BP, 1984. Risk of predation and the structure of desert rodent
communities. Ecology 65:689–701.
Kotler BP, Brown JS, Hasson O, 1991. Factors affecting gerbil foraging
behavior and rates of owl predation. Ecology 72:2249–2260.
Kotler BP, Brown JS, Slotow RH, Goodfriend WL, Strauss M, 1993. The
influence of snakes on the foraging behavior of gerbils. Oikos 53:
145–152.
Larivière S, Pasitschniak-Arts M, 1996. Vulpes vulpes. Mammal Species
537:1–11.
Larivière S, Walton LR, 1997. Lynx rufus. Mammal Species 563:1–8.
Lima SL, 1998a. Nonlethal effects in the ecology of predator-prey
interactions. Bioscience 48:25–34.
437
Lima SL, 1998b. Stress and decision-making under the risk of
predation: recent developments from behavioral, reproductive,
and ecological perspectives. Adv Study Behav 27:215–290.
Lima SL, Bednekoff PA, 1999. Temporal variation in danger drives
antipredator behavior: the predation risk allocation hypothesis. Am
Nat 153:649–659.
Lima SL, Dill LM, 1990. Behavioral decisions made under the risk of
predation: a review and prospectus. Can J Zool 68:619–640.
Littell RC, Milliken GA, Stroup WW, Wolfinger RD, 1996. SAS system
for mixed models. Cary, North Carolina: SAS Institute.
Major JT, Sherburne JA, 1987. Interspecific relationships of coyotes,
bobcats, and red foxes in western Maine. J Wildl Manage 51:606–
616.
Morris DW, Davidson DL, 2000. Optimally foraging mice match patch
use with habitat differences in fitness. Ecology 81:2061–2066.
Nolte DL, Mason JR, Eppel G, Aronov E, Campbell DL, 1994. Why are
predator urines aversive to prey? J Chem Ecol 20:1505–1516.
Parsons GJ, Bondrup-Nielsen S, 1996. Experimental analysis of
behavior of meadow voles (Microtus pennsylvanicus) to odours of
the short-tailed weasel (Mustela erminea). Écoscience 3:63–69.
Quinn GP, Keough MJ, 2002. Experimental design and data analysis
for biologists. Cambridge: Cambridge University Press.
Rosell F, 2001. Effectiveness of predator odors as gray squirrel
repellents. Can J Zool 79:1719–1723.
SAS Institute, 2000. SAS user’s guide. Version 8.1. Cary, North
Carolina: SAS Institute.
Schmitz OJ, Beckerman AP, O’Brien KM, 1997. Behaviorally mediated
trophic cascades: effects of predation risk on food web interactions.
Ecology 78:1388–1399.
Stroup WW, 2002. Power analysis based on spatial effects mixed
models: a tool for comparing design and analysis strategies in the
presence of spatial variability. J Agric Biol Environ Stat 7:491–511.
Sullivan TP, Crump DR, Sullivan DS, 1988. Use of predator odors as
repellents to reduce feeding damage by herbivores, III: montane
and meadow voles (Microtus montanus and Microtus pennsylvanicus).
J Chem Ecol 14:363–377.
Swihart RK, 1991. Modifying scent-marking behavior to reduce
woodchuck damage to fruit trees. Ecol App 1:98–103.
Thomas L, 1997. Retrospective power analysis. Conserv Biol 11:276–
280.
Thorson J, Morgan R, Brown J, Norman J, 1998. Direct and indirect
cues of predatory risk and patch use by fox squirrels and 13-lined
ground squirrels. Behav Ecol 9:151–157.
Vander Wall SB, 1995. Influence of substrate water on the ability of
rodents to find buried seeds. J Mammal 76:851–856.
Weston JLM, 2002. Demographics of a protected population of gray
foxes (Urocyon cinereoargenteus) in South Carolina (PhD dissertation). Athens: University of Georgia.
Williamson M, 1996. Biological invasions. London: Chapman and
Hall.
Wolfe JL, Summerlin CT, 1989. The influence of lunar light on
nocturnal activity of the old-field mouse. Anim Behav 37:410–414.

