Jiangling Motors Corporation (JMC) 江铃汽车股份有限公司
advertisement
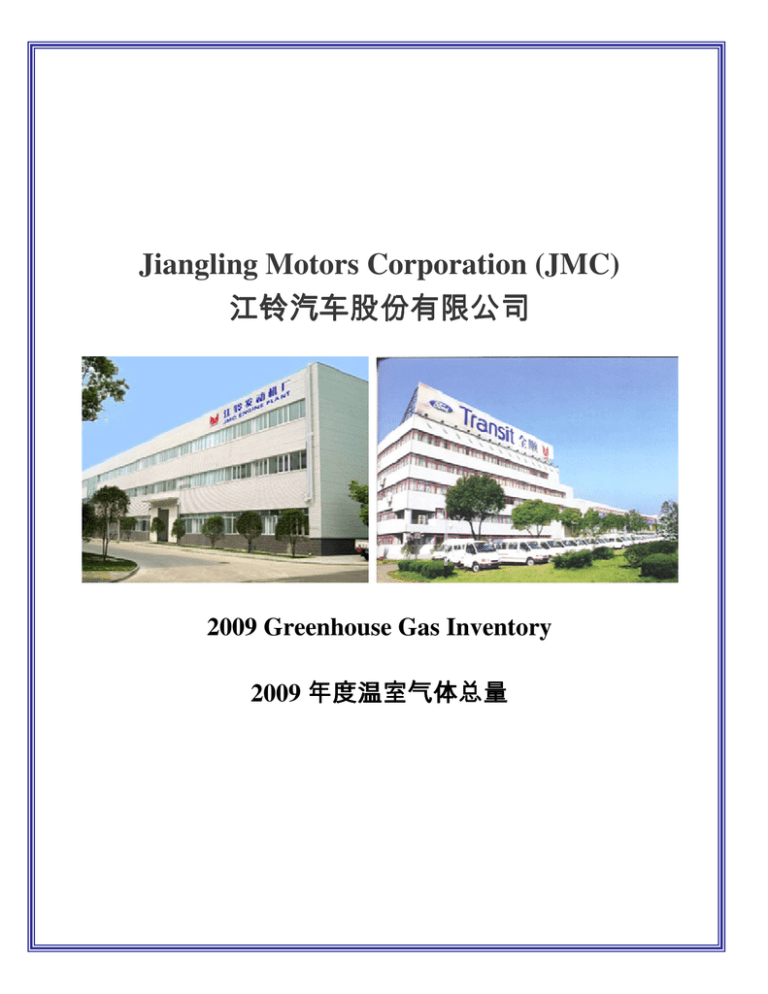
Jiangling Motors Corporation (JMC) 江铃汽车股份有限公司 2009 Greenhouse Gas Inventory 2009 年度温室气体总量 Executive Summary: Jiangling Motors Corporation (JMC) – a publicly-traded company in China with Ford as a 30% shareholder – is issuing the second report of its greenhouse gas emissions (GHG). JMC believes that the starting point of a corporate GHG strategy is to better understand its emissions. JMC is aware of the importance of Climate Change and it is committed to constantly improving its environmental performance and sharing results with others. JMC assembles the Ford Transit van and other non-Ford-technology-based vehicles for distribution in China. Ford is proud to participate in different greenhouse gas management initiatives worldwide including: The Chicago Climate Exchange (CCX), The Mexican GHG Program, The Philippines Greenhouse Gas Accounting and Reporting Program (PhilGARP), The Australian National Greenhouse Emissions Reporting System, The Climate Registry (TCR), The Brazilian GHG Program, The EU Emissions Trading Scheme (EU ETS), and The Canadian GHG Challenge Registry. The 2009 GHG inventory includes JMC data from 2003-2009. Overall JMC (JMC Transit and JMC Engine combined) has increased its absolute emissions by 67% compared to the baseline years and 8.6% compared to 2008. However, JMC Transit emissions intensity decreased by over 15% and JMC Engine emissions intensity decreased by over 3% over the same period. JMC will continue to provide an annual update of its GHG emissions inventory. 2 摘要: 江铃汽车股份有限公司(以下简称 JMC)是一家境内的上市公司,其中福特汽车公司 占 30%股份,现公布第二份温室气体总量报告。JMC 相信一个公司的 GHG 战略出发点是 为了更好地了解自身排放情况。JMC 已经认识到气候变化的重要性,并致力于不断提高自 身的环境业绩,同时与其它公司分享结果。 JMC 主要进行福特全顺系列车型和其它非福特技术汽车的总装以及在中国的经销。在 全球范围内,福特汽车公司非常荣幸地参与了多个国家的 GHG 管理计划,包括芝加哥气 候交易所(CCX)、墨西哥 GHG 计划、菲律宾 GHG 核算与报告计划(PhilGARP)、澳 大利亚国内温室排放报告系统、气候登记(TCR)、巴西 GHG 计划、欧盟排放交易计划 (EU ETS)以及加拿大 GHG 挑战登记。 JMC 的 2009 年度 GHG 总量包括其 2003 年至 2009 年度的数据。总体来说,JMC (包括 JMC 全顺厂和 JMC 发动机厂)的绝对排放比基准年上升了 67%,比 2008 年则上 升了 8.6%。但是,JMC 全顺厂的排放强度同期相比下降 15%以上,JMC 发动机厂的排放 强度同期相比下降 3%以上。JMC 将继续提供其温室气体总量年度更新资料。 3 Table of Contents: Introduction……………………………………………………………………………………….. 7 JMC Transit…………………………………………………………………………………10 JMC Engine ……………………………………………………………………...……..………. 15 Corporate Climate Change Initiatives ….……………………………………………............ 17 Methodology………………………………………………………………………...…..............22 Base Years …………………………………………………………………..………..……….. 25 GHG Emissions Data………………………………………………………………..….……… 27 Data Analysis……………………………………………………………………………………. 35 Conclusions…………………………………………………………………............................ 45 List of Figures Figure 1: V348 LWB Ford Transit…………………………………………………………….. 10 Figure 2: VE83 LWB Ford Transit…………………………………………………………….. 13 Figure 3: V348 Ford VAN Transit….…………………………….…………..……………….. 13 Figure 4: 4JB1 Engine…………………………………………………………………………..15 Figure 5: Puma Engine………………………………………………………………………….17 Figure 6: JMC Transit Absolute Emissions (2003-2009)…………………………………… 38 Figure 7: JMC Transit Emissions Intensity (2003-2009)…………………………………….41 Figure 8: JMC Engine Absolute Emissions (2003-2009)………………………...........43 Figure 9: JMC Engine Emissions Intensity (2003-2009)………………………..………….. 43 List of Tables Table 1: Emissions Factors……………………………………………………………………. 25 Table 2: Direct and Indirect Emissions Baseline……………………………………………..27 Table 3: JMC Energy Consumption and Production Volumes (2003-2009)...……........... 32 Table 4: JMC Direct Emissions……………………………………………………………….. 32 Table 5: JMC Indirect Emissions……………………………………………………………… 35 Table 6: JMC Absolute GHG Emissions…………………………………………….……….. 35 Table 7: JMC Type of Operation ………………………………………………...….............. 38 4 目录: 目录 介绍……………………………………………………………………………………………… 8 JMC 全顺……………………………………………………………………………………….. 11 JMC 发动机………………………………………………………………………...…….……. 16 集团气候变化应对计划 ….……………………………………………….............................. 18 方法……………………………………………………………………………......................... 23 基准年……………………………………………………………………...………..………….. 26 GHG 排放数据………………………………………………………………...….……………. 28 数据分析………………………………………………………………………………………… 36 结论…………………………………………………………………....................................... 46 图表目录 图 1: 福特全顺 V348 LWB……………………………………………….…………………….. 12 图 2: 福特全顺 VE83 LWB……………………………………………………………………... 14 图 3: 福特新世代全顺 V348….…………………………….………………………………… 14 图 4: 4JB1 发动机………………………………………………………………………………..16 图 5: JX4D24 发动机……………………………………………………………………………18 图 6: JMC 全顺厂绝对排放(2003-2009)……………………………………………………40 图 7: JMC 全顺厂排放强度(2003-2009)…………………………………………………42 图 8: JMC 发动机厂绝对排放(2003-2009)…………………………................................ 44 图 9: JMC 发动机厂排放强度(2003-2009)……………………..…………………………. 44 表格目录 表 1: 排放系数…………………………………………………………………………………… 26 5 表 2: 直接排放和间接排放基准值……………………………………………………………… 28 表 3: JMC 能耗和产量(2003-2009)...……..................................................................... 33 表 4: JMC 直接排放……………………………………………………………………………...33 表 5: JMC 间接排放……………………………………………………………………………...36 表 6: JMC 绝对 GHG 排放…………………………………………….………………………...36 表 7: JMC 业务类型…………………………………………………...…................................ 39 6 Introduction Jiangling Motors Corporation, Ltd. (JMC) is located in Jiangxi province, Nanchang and is one of the biggest companies in China. Ford entered a strategic partnership with JMC in 1995 by purchasing 20% of JMC's shares and increasing to 30% in 2005. JMC and Ford worked together to develop The Ford Transit in 1997 and the 4J engine in 1995. Current products include the new-generation Ford Transit and the JX4D24 engine. JMC produces up to 33,585 vehicles per year and up to 116,849 engines per year. One of the most important initiatives undertaken by JMC is the implementation of the ISO 14001 environmental management standard, where all aspects of the facility are included: air emissions, waste, water, and energy. In order to remain certified, a facility must undergo a surveillance audit each year that ensures adherence to guidelines, and measures the plant’s progress. JMC Transit Plant became ISO 14001 certified in 1999 and also obtained the National Environmental Label Certification in 2003. In 2004 JMC implemented ISO/TS16949, an internationally recognized quality management system for the automotive industry and the China Compulsory Certification (3C). 3C integrates quality and content controls on products for import and export into one procedure as part of China's commitment for entry into the World Trade Organization. In 2009 JMC received the National Enterprise Environmental Achievement Award which is considered to be the top level award of environmental protection. JMC was the only automaker to receive this award. .A highlight of JMC performance is the use of detailed management systems for all resource use (energy, solid and liquid waste, solvent use and water). Energy targets are set for each operation and monitoring systems are in place in all areas. Performance against targets is taken very seriously, energy engineers report out to senior management on performance against targets on a weekly basis. Other environmental initiatives include: energy efficiency projects and educational programs for employees. This GHG inventory includes data for JMC Transit and JMC Engine plants. JMC recognizes the importance of the climate change issue and will continue to work on 7 介绍 江铃汽车股份有限公司(以下简称 JMC)位于江西省南昌市,是中国最大的汽车制造 公司之一。福特汽车公司作为战略伙伴于 1995 年被引入,最初持有 20%的股份,到 2005 年,持股比例增加到 30%。 1997 年,JMC 和福特汽车公司联合开发推出福特全顺系列车型,1995 年生产出 4J 系 列发动机。目前产品包括新世代福特全顺和 JX4D24 发动机。JMC 年产 33,585 辆汽车和 116,849 台发动机。 JMC 采取的最重要举措之一是执行了 ISO 14001 环境管理标准,该标准涵盖了工厂 环境管理的各个方面,包括大气排放、废物、水和能源。为了维护该认证,工厂必须每年 进行一次监督审核以确保工厂达标,同时衡量工厂所取得的进步。JMC 全顺厂于 1999 年 取得 ISO14001 认证,并在 2003 年获得国家环境标致产品认证。2004 年,JMC 开始执行 被全球认可的汽车行业的质量管理体系 ISO/TS16949 和中国强制性产品认证制度(简称 3C 认证)。3C 认证作为中国加入世贸组织承诺的一部分,它将质量和产品进出口控制整 合为一个程序。2009 年,JMC 获得被视为中国环境保护领域的最高奖项的全国企业环保 成就奖。JMC 是唯一获此殊荣的汽车生产商。 JMC 其中一个显著的成效是对资源利用(包括:能源、固体和液体废物、溶液和水) 进行细致的体系化管理。厂内所有场所均有安装监测系统,并对每个工艺提出能源目标。 工厂对目标能耗的达标要求十分严格,能源工程师每星期直接向高级管理层汇报成效。其 它环境计划包括:节能项目和员工教育计划。 8 本总量报告包括 JMC 全顺厂和 JMC 发动机厂的数据。JMC 认识到气候变化问题的重 要性, 9 reducing GHG emissions of our vehicles and facilities by way of introducing advanced technology vehicles and improving energy efficiency in manufacturing operations. JMC Transit: Product: Transit with Multiple Configurations (VE83 LWB, VE83 SWB, VE83 CAB, V348 LWB, V348 SWB, V348 JUMBO) Founded: 1995 Plant Capacity: 58,000 vehicles/year Operation: Vehicle Assembly Employees (2009): 942 employees Site: 120,000m2 Floor Space: 98,000m2 ISO 14001Certified: 2003 Figure 1: V348 LWB Ford Transit 10 并将通过引进含有先进技术的汽车和提高生产过程中的能效来继续减少其汽车和工厂的 GHG 排放。 JMC 全顺厂: 全顺厂 产品: 产品 全顺系列(VE83 LWB, VE83 SWB, VE83 CAB, V348 LWB, V348 SWB, V348 JUMBO) 成立年份: 成立年份 1995 年 产能: 产能 5.8 万辆/年 业务: 业务 汽车总装 员工人数(2009) ): 942 人 员工人数( 占地面积: 占地面积 12 万平方米 建筑面积: 建筑面积 9.8 万平方米 ISO 14001 认证年份: 认证年份 2003 年 11 图 1: 福特全顺 V348 LWB 12 Figure 2: VE83 LWB Ford Transit Figure 3: V348 Ford VAN Transit 13 图 2: 福特全顺 VE83 LWB 图 3: 福特新世代全顺 V348 14 JMC Engine: Product: 4JB1 engine, and PUMA engine* Founded: 1995 Plant Capacity: 98,000 units/year Operation: Engines Employees (2009): 778 employees Site: 51,000m2 Floor Space: 41,000m2 ISO 14001Certified: 2001 *JMC engine also manufactures the Cylinder Heads, Cylinder Blocks, crankshafts and connecting Rods for its engines. Figure 4: 4JB1 Engine 15 JMC 发动机厂: 发动机厂 产品: 产品 4JB1 发动机和 JX4D24 发动机* 成立年份: 成立年份 1995 年 产能: 产能 9.8 万台/年 业务: 业务 发动机 员工人数(2009) ): 778 人 员工人数( 占地面积: 占地面积 5.1 万平方米 建筑面积: 建筑面积 4.1 万平方米 ISO 14001 认证年份: 认证年份 2001 年 注:JMC 发动机厂同时还生产发动机配套的缸盖、缸体、机轴和连杆。 图 4: 4JB1 发动机 16 Figure 5: Puma Engine Corporate Climate Change Initiatives: JMC is proud to be one of the first automobile companies to voluntarily report its GHG emissions in China. We believe that climate change is a serious environmental issue and recognize that it is not possible to wait for all the scientific uncertainties to be resolved. Ford Motor Company is actively participating in various programs around the world gaining considerable experience in GHG reporting. Some of the initiatives are listed below: Chicago Climate Exchange (CCX): The Chicago Climate Exchange (CCX) is a greenhouse gas (GHG) emission reduction and trading program for emission sources and projects in North America. It is a selfregulated, rules based exchange designed and governed by CCX members. These members have made a voluntary, legally binding commitment to reduce their emissions of greenhouse gases by six percent below 2000 baseline year by 2010. Ford is the first and only auto manufacturing participant in this program. 17 图 5: Puma 发动机 集团气候变化管理计划: 集团气候变化管理计划 JMC 是中国首批自愿公布其 GHG 排放的汽车公司之一,为此,我们感到非常骄傲。 我们相信气候变化是一个严重的环境问题,并认为我们不能等待所有的科学不确定性明朗 以后再来行动。福特汽车公司正积极地参与全世界各种 GHG 计划并获得了一定的 GHG 报 告的经验。以下是我们参与过的部分 GHG 管理计划: 芝加哥气候交易所(CCX) ): 芝加哥气候交易所( 芝加哥气候交易所(CCX)是北美地区的 GHG 减排与交易系统。CCX 是由会员设计 和智利,自愿形成的一套交易体系。这些成员自愿地通过法律约定的承诺在 2010 年前, 18 基于 2000 年的基准值消减 GHG 排放量 6%。福特汽车公司是第一家,也是唯一一家参与 这个计划汽车制造公司。 19 Mexico GHG Pilot Program: The Mexico GHG Program started as a two year partnership between La Secretaria de Medio Ambiente y Recursos Naturales (SEMARNAT), World Resources Institute (WRI) and World Business Council for Sustainable Development (WBCSD). It is a voluntary program established to help Mexican companies to quantify greenhouse gas emissions. Ford Motor Company was proud to be the only auto manufacturer to participate in the first phase of the program where we are committed to reporting emissions annually. EU Emissions Trading Scheme (EU ETS): Ford participates in the EU ETS which commenced in January 2005 and is one of the policies being introduced across Europe to reduce emissions of carbon dioxide and other greenhouse gases. The second phase of this program runs from 2008-2012 and coincides with the first Kyoto Commitment Period. Further 5-year periods are expected subsequently. Canadian Voluntary Challenge and Registry: Ford voluntarily reports GHG emissions to the Canadian Voluntary Challenge and Registry (VCR). It has been reporting annual emissions since 1999. Over the years, it has received the highest level of achievement in the reporting system, which includes two Leadership Awards in the Automotive Manufacturing Sector category as well as qualifying as a Silver Champion Level Reporter in 1999 and Gold Champion Level Reporter from 2000 to 2003, 2005 & 2006. Philippines GHG Program The Philippine Greenhouse Gas Accounting and Reporting Program (PhilGARP) partnership between Klima Climate Change Center of the Manila Observatory, Philippine Business for the Environment, the Department of the Environment and Natural Resources, Department of Energy, WBCSD, and WRI – was launched in November 2006. 20 墨西哥 GHG 试验计划: 试验计划 墨西哥 GHG 试验计划是由 La Secretaria de Medio Ambiente y Recursos Naturales (SEMARNAT)、世界资源研究所(WRI) 和世界可持续发展工商理事会(WBCSD)发起的为期 两年的合作计划。作为一个自愿计划,墨西哥 GHG 试验计划的成立旨在协助墨西哥企业 计算其 GHG 排放量。福特汽车公司是唯一一家参与该计划的第一阶段的汽车制造企业, 并承诺每年报告其排放量。 欧盟排放权交易方案 欧盟排放权交易方案 (EU ETS): 福特汽车公司参与的 EU ETS 于 2005 年 1 月正式启动,是欧洲减少二氧化碳和其它 GHG 排放的方针的其中之一。该方案的第二阶段于 2008 年到 2012 年实施,这一时期也 是《京都议定书》首次正式实施的时间。随后会又有一个五年方案。 加拿大 GHG 挑战与 挑战与登记: 登记 从 1999 年起,福特汽车公司自愿向加拿大 GHG 挑战与登记(VCR)报告其年度 GHG 排放量。时至今日,福特汽车公司已经在 VCR 的报告系统里取得最高级别的成绩, 包括两次获得汽车制造行业领导力奖,此外还获得 1999 年度银牌报告者称号以及 2000- 2003 年度、2005 年度和 2006 年度金牌报告者称号。 菲律宾 GHG 计划: 菲律宾 GHG 计算与报告计划(PhilGARP)由马尼拉天文台的 Klima 气候变化中心、菲 律宾环境商务部、环境与自然资源部、能源部、WBCSD 和 WRI 于 2006 年 11 月联合发 起。 21 The Climate Registry (TCR) The Climate Registry in North America provides accurate and transparent measurement of GHG emissions and ensures consistency of measurement metrics across industry sectors and borders. The Climate Registry accounting infrastructure supports both voluntary and regulatory programs. Ford is a founding member and the first automaker to participate in the program. Brazilian GHG Reporting Program The Brazil Greenhouse Gas program is a partnership of Brazil’s Ministry of Environment, the Brazilian Business Council for Sustainable Development, the Fundação Getúlio Vargas, the World Business Council on Sustainable Development, and the World Resources Institute (WRI). Ford of Brazil is proud to be the first automobile company in Brazil to voluntarily report its Facility Greenhouse Gas (GHG) emissions. Methodology: The data used to calculate the baseline and reporting year is based on actual electricity and natural gas invoices obtained directly from the utilities, gasoline and diesel invoices from the supplier. JMC uses a best in class energy monitoring system and an industry-leading Global Emissions Manager (GEM) database to ensure environmental metrics such as CO2 emissions are tracked consistently. All energy data contained in this report is available within GEM and it is tracked and revised by the facility. The emissions data reported was generated following the GHG calculation tools developed by the World Resources Institute (WRI). This report includes "direct" emissions characterized as scope 1 in the WRI/WBCSD protocol and "indirect" or scope 2 emissions from the same protocol. All CO2 emissions are included and reported in units of metric tons of carbon dioxide (CO2). Other GHG applicable to combustion processes, CH4 and N2O, are estimated to be less than 1% of the total emissions and hence considered negligible. Other emission sources such as HFCs from refrigerant leakages during the initial vehicle fill process for the air 22 气候变化注册组织 气候变化注册组织 (TCR) 北美的气候变化注册组织(TCR)提供精准和透明的 GHG 排放测量方法,并保证各 行业和地区使用一致的度量法。气候变化注册组织的下属统计机构即支持自愿的,也支持 法定的管理计划。福特汽车公司是气候变化注册组织的创始成员,也是第一家加入该组织 的汽车制造商。 巴西 GHG 报告计划 报告计划 巴西 GHG 计划由巴西环境部、巴西可持续发展商业理事会、the Fundação Getúlio Vargas、WBCSD 和 WRI 共同发起。巴西的福特汽车公司是巴西国内第一家自愿报告其 GHG 排放量的汽车制造商。 方法 用来计算基准值和报告年的数据是直接来自公用事业单位出具的电费和天然气费发 票,以及从供应商处取得的汽油和柴油费发票。 JMC 运用最高等级的能源监控系统和行业领先的全球排放管理(GEM)数据库,以 确保环境因素例如二氧化碳排放量得到持续一致的跟踪。本报告的所有能源数据均包含在 GEM 里,并通过工厂进行跟踪和修正。本报告的排放数据是通过世界能源研究所(WRI) 建立的 GHG 计算工具计算得出。 本报告包括由 WRI 和 WBCSD 协议里定义为范围一的直接排放源和范围二的间接排 放源。报告里所有的二氧化碳排放量单位均为公制吨二氧化碳当量。其它 GHG,例如甲烷 23 和一氧化二氮的排放估量在总排放量的 1%以下,因此忽略。其它排放源,如在汽车空调 初填充制冷剂时渗漏的含氟烃类, 24 conditioning units are also considered minimal at less than 1.9 % of total emissions. PFCs and SF6 do not apply to the company's manufacturing facilities. Emission factors in Table 1 were used to calculate CO2 emissions. Table 1: Emission Factors Fuel Gasoline/Petroleum Factor 0.0023403tCO2/l Diesel 0.0027tCO2/l Coal (Anthracite) 2.624tCO2/t Electricity 0.000849tCO2/KWh Note: From WRI/WCSB Base Years: JMC began operations in 1987 and has increased production every year. We have selected the average annual emissions over 2003-2006 as our representative baseline going forward. The baseline takes into account all years for which we have accurate and complete energy data. Table 2 shows the direct and indirect emissions used to obtain the baseline. Note: Direct emissions are those generated on site (i.e. from diesel, or petroleum fuel use). Indirect emissions are those generated off site but attributable to car manufacturing (i.e. electricity used on site). 25 其排放量可视为总排放量 1.9%以下。本公司的制造工厂没有使用到全氟烃类和六氟化 硫。 表 1 里的排放指标是用作二氧化碳排放量的计算。 表 1: 排放指标 燃料 汽油/石油 指标 0.0023403吨二氧化碳/升 柴油 0.0027吨二氧化碳/升 煤(无烟煤) 2.624吨二氧化碳/吨 电 0.000849吨二氧化碳/千瓦时 来源:WRI和WCSB 基准年: 基准年 JMC 于 1987 年开始运行,产量逐年递增。我们选取 2003 至 2006 年度的平均年排放 量作为我们的基准值。该基准值考虑到所有能源数据精确而完整的年份。表 2 显示了用作 计算基准值的直接和间接排放。 注:直接排放来自厂内(如燃烧柴油或石油)。间接排放来自于厂外,但是归于汽车制造过程的(如厂内用 电)。 26 Table 2: Direct and Indirect Emissions Baseline JMC Transit - Direct Emissions (metric tCO2) 2003 2004 2005 2006 Baseline 5,805 6,323 7,641 7,983 6,938 JMC Transit - Indirect Emissions (metric tCO2) 2003 2004 2005 2006 Baseline 12,477 12,448 16,899 18,622 15,111 JMC Transit - Production 2003 2004 2005 2006 Baseline 11,399 12,894 18,720 23,064 16,519 JMC Engine - Direct Emissions (metric tCO2) 2003 2004 2005 2006 Baseline 432 435 467 507 460 JMC Engine - Indirect Emissions (metric tCO2) 2003 2004 2005 2006 Baseline 5,619 6,073 7,958 7,817 6,867 JMC Engine - Production 2003 2004 2005 2006 Baseline 59,910 68,849 85,780 91,356 76,474 GHG Emissions Data: JMC Transit and JMC Engine plants were constructed with state of the art technology that allows the plants to operate in an energy efficient manner. JMC's internal energy management and control process allows the plants to monitor energy usage throughout the facilities and identify areas that can be improved. JMC is committed to improving energy efficiency and reducing its GHG emissions. The plants have implemented several projects in the last couple of years to reduce energy consumption (electricity and natural gas) including: JMC Transit: • Performing weekly analysis of power equipment, identifying energy reduction opportunities for improvements. 27 表 2: 直接和间接排放基准值 JMC 全顺厂-直接排放(计量单位:吨二氧化碳) 全顺厂-直接排放(计量单位:吨二氧化碳) 2003 2004 2005 2006 基准值 5,805 6,323 7,641 7,983 6,938 JMC 全顺厂-间接排放(计量单位:吨二氧化碳) 顺厂-间接排放(计量单位:吨二氧化碳) 2003 2004 2005 2006 基准值 12,477 12,448 16,899 18,622 15,111 JMC 全顺厂-产量 全顺厂-产量 2003 2004 2005 2006 基准值 11,399 12,894 18,720 23,064 16,519 JMC 发动机厂-直接排放(计量单位:吨二氧化碳) 发动机厂-直接排放(计量单位:吨二氧化碳) 2003 2004 2005 2006 基准值 432 435 467 507 460 JMC 发动机厂-间接排放(计量单位:吨二氧化碳) 发动机厂-间接排放(计量单位:吨二氧化碳) 2003 2004 2005 2006 基准值 5,619 6,073 7,958 7,817 6,867 JMC 发动机厂-产量 发动机厂-产量 2003 2004 2005 2006 基准值 59,910 68,849 85,780 91,356 76,474 GHG 排放数据: 排放数据 JMC 全顺厂和 JMC 发动机厂运用最先进的技术建造而成,使其以更节能的方式运 作。JMC 的内部能源管理和控制流程可以监控工厂内部各环节的能源使用情况,并识别出 可以改进的地方。 JMC 承诺致力于提高能效并减少其 GHG 排放。近几年来,工厂已经实施了若干降低 能耗(电和天然气)的措施,包括: JMC 全顺厂: 全顺厂 28 • 每周定期进行电力设备分析,识别节能改进机会。 29 • Installation of an infrared radiation lamp with the purpose of heating coated plate radiation plate reducing the consumption of power by 12KW compared to conventional heating equipment. • Installation of an air supply fan inverter in the paint shop. The fan increases heat conductivity reducing the amount of power consumed by 35KW. JMC Engine: • Processes are in place to continually adjust energy consumption depending on production. This reduces the amount of energy consumed during production shut downs. • Reduced energy consumption through equipment modification, process optimization and energy-saving technologies. Upgraded electrical system, distribution between the energy-saving (power lines and light lines intersect, resulting in three-phase voltage imbalance), reducing the amount of electricity consumed. • In 2008, the plant evaluated its compressed air pipe network and upgraded the system using a more efficient layout. This action significantly reduced energy consumption as the network's area has been reduced. JMC has worked hard at identifying energy reduction opportunities within the plant. Appropriate employee training has been a priority for JMC. In addition, activities to reduce electricity include: reduction of light bulbs at process areas, offices and other unused areas, turning off lights and office equipment during break-time, replacement of air conditioner refrigerant gas to increase energy efficiency and reduce impact on ozone, turning off compressors during the weekends and repairing compressed air leaks. Table 3 shows JMC energy consumption and production volumes from 20032009. Direct Emissions: Direct Emissions result from combusting fuels at the JMC plants including diesel, coal and gasoline. Most gasoline is not combusted at the site. Instead, it is used to fill 30 安装红外辐射照射灯,目的是使涂层材料板的加热比使用传统加热装置减少功率消 • 耗 12 千瓦。 在涂装车间安装风机变逆器,提高热传导性,从而减少功率消耗 35 千瓦。 • JMC 发动机厂: 发动机厂 • 所有工艺随着生产情况而不断调整能耗。由此可以减少停产期间的能源。 • 通过设备改造、工艺优化,节能技术的运用等来减少能源的消耗,如对设备电器系 统进行升级改造;配电间节能改造(动力线与照明线路的相互交叉,造成三相电压 不平衡,产生电能的浪费);对各区配电柜无功功率进行补偿. 2008 年,工厂对其压缩空气管网进行评估并升级系统。通过减少管网这一举措,能 • 耗大大地降低了。 JMC 在识别节能机会上付出相当大的努力。适当的员工培训已经成为 JMC 的首要任 务。此外,还有各种节电措施包括:在加工区域、办公室和其它未使用区域减少灯泡数 量;在休息时间关掉电灯和办公设备;更换空调制冷剂以提高其能效以及减少臭氧的影 响;在周末期间关闭压缩机并对于漏气进行维修。表 3 显示了自 2003 年到 2009 年能耗和 产量。 直接排放: 直接排放 直接排放来自于 JMC 工厂燃烧燃料,包括柴油、煤和汽油。大多数汽油并不是在厂 里燃烧。 31 fuel tanks of new vehicles leaving the site. Table 4 shows direct emissions from 20032009 Table 3: JMC Energy Consumption and Production Volumes from 2003-2009 JMC Transit Energy Consumption and Production Volumes (2003-2009) Diesel (liters) Coal (metric tons) Gasoline (liters) Electricity (KWh) Production 2003 2004 2005 2006 2007 2008 2009 1,078,000 1,105,500 1,523,000 1,553,200 1,925,000 2,546,483 2,471,389 1,103 1,272 1,345 1,444 1,282 1,051 1,343 0 0 0 0 27,700 48,327 37,461 14,696,467 14,662,006 19,904,099 21,933,864 27,897,202 30,699,582 33,023,194 11,399 12,894 18,720 23,064 26,568 27,001 34,168 JMC Engine Energy Consumption and Production Volumes (2003-2009) Diesel (liters) Electricity (KWh) Production 2003 2004 2005 2006 2007 2008 2009 160,030 161,100 173,120 187,730 195,200 186,450 189,500 6,618,208 7,153,616 9,372,920 9,207,610 10,413,850 10,485,072 12,087,389 59,910 68,849 85,780 91,356 104,489 98,920 116,849 Table 4: JMC Direct Emissions JMC Transit Direct GHG Emissions by Fuel Type (2003-2009) 2003 2004 2005 2006 2007 2008 2009 Diesel (tCO2) 2,911 2,985 4,112 4,194 5,198 6,876 6,673 Coal (tCO2) 2,894 3,338 3,529 3,789 3,363 2,758 3,524 0 0 0 0 65 113 88 5,805 6,323 7,641 7,983 8,625 9,746 10,284 Gasoline (tCO2) Total (tCO2) JMC Engine Direct GHG by Fuel Type Emissions (2003-2009) 2003 2004 2005 2006 2007 2008 2009 Diesel (tCO2) 432 435 467 507 527 503 512 Total (tCO2) 432 435 467 507 527 503 512 Total Direct JMC Emissions (Transit and Engine) - (2003-2009) Transit and Engine (tCO2) 2003 2004 2005 2006 2007 2008 2009 6,237 6,758 8,109 8,490 9,152 10,250 10,796 32 而是在车辆出厂时加油所产生的。表 4 显示了 2003 年至 2009 年直接排放的数据。 表 3: JMC 2003- -2009 年度能耗和产量 JMC 全顺厂能耗和产量( -2009) ) 全顺厂能耗和产量(2003- 能耗和产量( 2003 2004 2005 2006 2007 2008 2009 柴油(升) 1,078,000 1,105,500 1,523,000 1,553,200 1,925,000 2,546,483 2,471,389 煤(公吨) 1,103 1,272 1,345 1,444 1,282 1,051 1,343 汽油(升) 汽油(升) 0 0 0 0 27,700 48,327 37,461 14,696,467 14,662,006 19,904,099 21,933,864 27,897,202 30,699,582 33,023,194 11,399 12,894 18,720 23,064 26,568 27,001 34,168 电(千瓦时) 产量 JMC 发动机厂能耗和产量( ) 发动机厂能耗和产量(2003-2009) 能耗和产量( 柴油(升) 电(千瓦时) 产量 2003 2004 2005 2006 2007 2008 2009 160,030 161,100 173,120 187,730 195,200 186,450 189,500 6,618,208 7,153,616 9,372,920 9,207,610 10,413,850 10,485,072 12,087,389 59,910 68,849 85,780 91,356 104,489 98,920 116,849 表 4: JMC 直接排放 JMC 全顺厂 GHG 直接排放(燃料种类)(2003-2009) ) 直接排放(燃料种类)( 2003 2004 2005 2006 2007 2008 2009 柴油(吨二氧化碳) 2,911 2,985 4,112 4,194 5,198 6,876 6,673 煤(吨二氧化碳) 2,894 3,338 3,529 3,789 3,363 2,758 3,524 汽油(吨二氧化碳) 0 0 0 0 65 113 88 总量(吨二氧化碳) 5,805 6,323 7,641 7,983 8,625 9,746 10,284 JMC 发动机厂 GHG 直接排放(燃料种类)(2003-2009) ) 直接排放(燃料种类)( 2003 2004 2005 2006 2007 2008 2009 柴油(吨二氧化碳) 432 435 467 507 527 503 512 总量(吨二氧化碳) 432 435 467 507 527 503 512 2008 2009 JMC 总直接排放(全顺厂 ) 总直接排放(全顺厂和发动机厂 和发动机厂)-(2003-2009) )-( 2003 2004 2005 2006 2007 33 全顺厂 全顺厂和发动机厂 和发动机厂 (吨二氧化碳) 6,237 6,758 8,109 8,490 9,152 10,250 10,796 34 Indirect Emissions JMC Indirect Emissions include all emissions generated outside the site's perimeter such as emissions from burning fossil fuel to generate electricity. JMC continuously monitors its electricity consumption. However the rate of energy consumption depends heavily on production, and if production increases, so will energy consumption. Table 5 shows indirect emissions per year from 2003-2009. Table 5: JMC Indirect Emissions JMC Transit Indirect GHG Emissions (2003-2009) Electricity (tCO2) 2003 2004 2005 2006 2007 2008 2009 12,477 12,448 16,899 18,622 23,685 26,064 28,037 JMC Engine Indirect GHG Emissions (2003-2009) Electricity (tCO2) 2003 2004 2005 2006 2007 2008 2009 5,619 6,073 7,958 7,817 8,841 8,902 10,262 JMC Total Indirect GHG Emissions (2003-2009) Transit and Engine (tCO2) 2003 2004 2005 2006 2007 2008 2009 18,096 18,521 24,856 26,439 32,526 34,966 38,299 Data Analysis: JMC Total Emissions: Overall JMC (JMC Transit and JMC Engine combined) has increased its absolute emissions by 67% compared to the baseline years and 8.6% compared to 2008 (Table 6). Table 6: JMC Absolute GHG Emissions (2003-2009) JMC Total Absolute GHG Emissions (2003-2009) Transit and Engine (tCO2) 2003 2004 2005 2006 2007 2008 2009 24,333 25,279 32,965 34,929 41,678 45,215 49,095 For the purposes of providing a detailed analysis we have separated the GHG emissions by type of operation (Engine and Assembly). Refer to Table 7 below for detailed information. 35 间接排放 JMC 间接排放包括厂外所产生的排放,如在发电过程中燃烧化石燃料。JMC 长期监 控其用电量。但是用电量受生产影响较大,生产量加大,用电量也随之增大。表 5 展示了 工厂 2003-2009 年的间接排放。 表 5: JMC 间接排放 JMC 全顺厂 GHG 间接排放(2003-2009) ) 间接排放( 电(吨二氧化碳) 2003 2004 2005 2006 2007 2008 2009 12,477 12,448 16,899 18,622 23,685 26,064 28,037 JMC 发动机厂 GHG 间接排放(2003-2009) ) 间接排放( 电(吨二氧化碳) 2003 2004 2005 2006 2007 2008 2009 5,619 6,073 7,958 7,817 8,841 8,902 10,262 JMC 总间接排放(全顺厂和发动机厂)(2003-2009) ) 总间接排放(全顺厂和发动机厂)( 全顺厂和发动机厂 (吨二氧化碳) 2003 2004 2005 2006 2007 2008 2009 18,096 18,521 24,856 26,439 32,526 34,966 38,299 数据分析: 数据分析 JMC 总排放: 总体来说,JMC(包括 JMC 全顺厂和 JMC 发动机厂)的绝对排放比基准年上升了 67 %,同时比 2008 年上升了 8.6%(如表 6)。 表 6: JMC GHG 绝对排放(2003-2009) ) 绝对排放( JMC GHG 总绝对排放(2003-2009) ) 总绝对排放( 全顺厂和发动机厂 (吨二氧化碳) 2003 2004 2005 2006 2007 2008 2009 24,333 25,279 32,965 34,929 41,678 45,215 49,095 36 为了提供具体分析,我们将 GHG 排放依照生产类型(发动机和总装)分别计算。具 体如表 7 所示。 37 Table 7: JMC Type of Operation JMC Transit Assembly JMC Engine Engine JMC Transit Assembly: JMC Transit Assembly production increased significantly since 2003 as multiple configurations of Transit have been introduced. Table 3 shows JMC Transit production data from 2003-2009. In 2009, JMC Transit increased its absolute emissions by 74% compared with the baseline years (2003-2006) and 7% compared to 2008 (Figure 6). Absolute emissions are directly proportional to production, if production increases so does absolute emissions. JMC Transit has implemented many projects and activities to reduce energy consumption and become more efficient. Figure 6: JMC Transit Absolute Emissions (2003-2009) JMC Transit Absolute Emissions (2003-2009) 45,000 40,000 35,000 tCO2 30,000 25,000 20,000 15,000 10,000 5,000 2003 2004 2005 2006 2007 2008 2009 Year Absolute Emissions Baseline (2003-2006) 38 表 7: JMC 生产类型 JMC 全顺厂 总装 JMC 发动机厂 发动机 JMC 全顺总装厂: JMC 全顺总装厂的产量自 2003 年多种全顺车型的引入而大幅提高。表 3 显示了 JMC 全顺厂 2003-2009 年的产量。 2009 年,JMC 全顺厂的绝对排放相对于基准年(2003-2006)上升了 74%,相对 2008 年上升了 7%(如图 6)。绝对排放直接与产量直接相关,如果产量增加,则绝对排 放增加。JMC 全顺厂已经采取了多个项目和计划来减少能耗和提高效率。 图 6: JMC 全顺厂绝对排放( ) 全顺厂绝对排放(2003-2009) 绝对排放( 39 JMC Transit Absolute Emissions (2003-2009) JMC 全顺厂绝对排放(2003-2009) 45,000 40,000 35,000 tCO2 30,000 25,000 20,000 15,000 10,000 5,000 2003 2004 2005 2006 2007 2008 2009 Year Absolute 绝对排放 Emissions Baseline (2003-2006) 基准年(2003-2006) 40 Emissions intensity can be used to measure efficiency on an energy use per car basis. Emission intensity is calculated by dividing absolute emissions by the number of production units (vehicles built). In 2009, emissions intensity decreased by 15.7% in comparison to the baseline years (2003-2006) and 15.4% compared to 2008. This means that the plants are emitting lower emissions per vehicle produced since the baseline years (Figure 7). Figure 7: JMC Transit Emissions Intensity (2003-2009) JMC Transit Emissions Intensity (2003-2009) 1.80 1.60 tCO2/Vehicle 1.40 1.20 1.00 0.80 0.60 0.40 0.20 0.00 2003 2004 2005 2006 2007 2008 2009 Year Intensity Emissions Baseline (2003-2006) JMC Engine The JMC Engine Plant has increased its absolute emissions by 47% compared to the baseline years (2003-2006) and by 14.5% compared to 2008 (Figure 8). Emissions intensity decreased by 4% compared to the baseline years (2003-2006) and by 3% compared to 2008 (Figure 9). 41 排放强度可以用来衡量单位汽车的能效。排放强度的计算是基于绝对排放除以生产单 位的个数(即汽车)。2009 年,排放强度比基准年(2003-2006)下降了 15.7%,比 2008 年下降了 15.4%。这意味着自基准年以来,单位汽车的排放正在逐渐降低(图 7)。 图 7: JMC 全顺厂排放强度( ) 全顺厂排放强度(2003-2009) 排放强度( JMC Transit Emissions Intensity (2003-2009) JMC 全顺厂排放强度(2003-2009) 1.80 1.60 tCO2/Vehicle 1.40 1.20 1.00 0.80 0.60 0.40 0.20 0.00 2003 2004 2005 2006 2007 2008 2009 Year 年 Intensity 排放强度 Emissions Baseline (2003-2006) 基准年(2003-2006) JMC 发动机厂 JMC 发动机厂的绝对排放比基准年(2003-2006)上升了 47%,比 2008 年上升了 14.5%(图 8)。排放强度比基准年(2003-2006)下降了 4%,比 2008 年下降了 3% (图 9)。 42 Figure 8: JMC Engine Absolute Emissions (2003-2009) JMC Engine Absolute Emissions (2003-2009) 12,000 10,000 tCO2 8,000 6,000 4,000 2,000 2003 2004 2005 2006 2007 2008 2009 Year Absolute Emissions Baseline (2003-2006) Figure 9: JMC Engine Emissions Intensity (2003-2009) JMC Engine Emissions Intensity (2003-2009) tCO2/engine 0.110 0.100 0.090 0.080 2003 2004 2005 2006 2007 2008 2009 Year Intensity Emissions Baseline (2003-2006) 43 图 8: :JMC 发动机厂绝对排放(2003-2009) 发动机厂绝对排放( ) JMC Engine Absolute Emissions (2003-2009) JMC 发动机厂绝对排放(2003-2009) 12,000 10,000 tCO2 8,000 6,000 4,000 2,000 2003 2004 2005 2006 2007 2008 2009 年 Year Absolute Emissions 绝对排放 Baseline (2003-2006) 基准年(2003-2006) 图 9: :JMC 发动机厂排放强度(2003-2009) ) 发动机厂排放强度( JMC Engine Emissions Intensity (2003-2009) JMC 发动机厂排放强度(2003-2009) tCO2/engine 0.110 0.100 0.090 0.080 2003 2004 2005 2006 2007 2008 2009 Year 年 Intensity Emissions 排放强度 Baseline (2003-2006) 基准年(2003-2006) 44 Conclusions Jiangling Motors Corporation, Ltd. (JMC) is proud to be among the first automobile companies in China to voluntarily report its GHG emissions. This report includes data from 2003-2009. JMC recognizes the importance of the climate change issue and supports emissions reporting at a national level. JMC is committed to improving energy efficiency, reducing GHG emissions and maintaining and exceeding its environmental standards. Overall JMC (JMC Transit and JMC Engine combined) has increased its absolute emissions by 67% compared to the baseline years and 8.6% compared to 2008. However, JMC Transit emissions intensity decreased by over 15% and JMC Engine emissions intensity decreased by over 3% over the same period. JMC will continue to provide an annual update of its GHG emissions inventory. 45 结论 江铃汽车股份有限公司(简称 JMC)作为中国首批自愿公布其 GHG 排放的汽车发动 机制造公司之一,我们感到非常骄傲。第一份报告包括了 2003-2008 年度的数据。JMC 认 识到气候变化问题的重要性,并在国家层面上支持 GHG 排放的公布。JMC 承诺将努力提 高能效,减少温室气体排放,并致力于保持并超越其自身的环境标准。 总体来说,JMC(包括 JMC 全顺厂和 JMC 发动机厂)的绝对排放比基准年上升了 67 %,比 2008 年上升了 8.6%。但是,JMC 全顺厂的排放强度同期相比下降 15%以上, JMC 发动机厂的排放强度同期相比下降 3%以上。JMC 将继续提供其温室气体总量年度更 新资料。 46
