18.03 Exercises ( ) −
advertisement
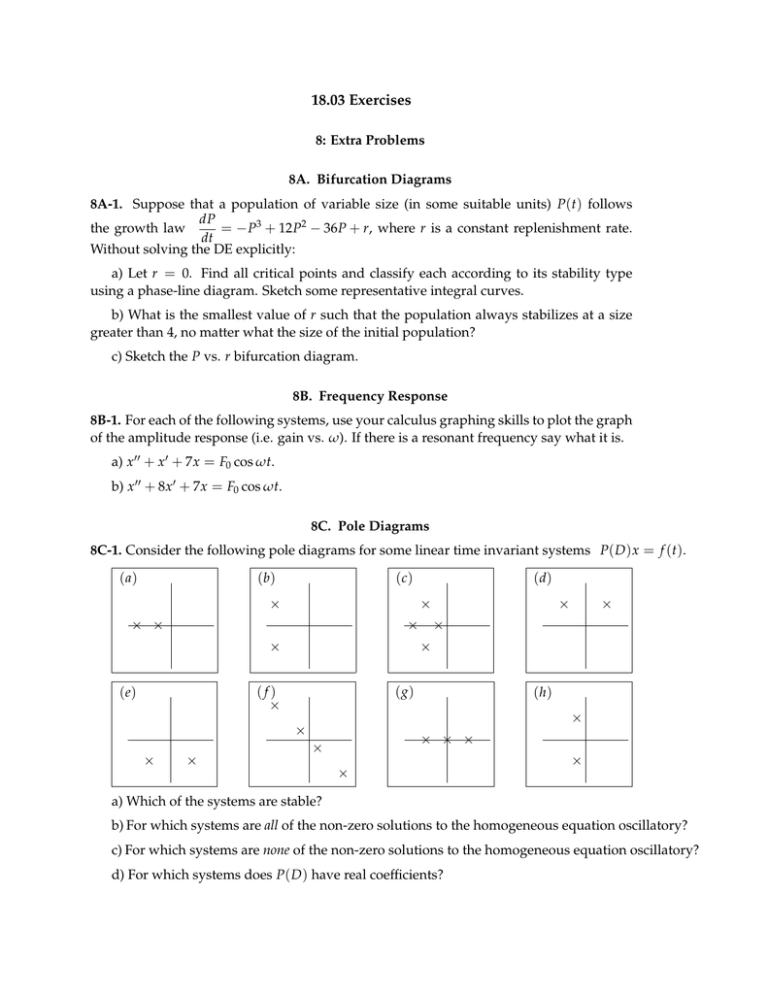
18.03 Exercises 8: Extra Problems 8A. Bifurcation Diagrams 8A-1. Suppose that a population of variable size (in some suitable units) P(t) follows dP the growth law = − P3 + 12P2 − 36P + r, where r is a constant replenishment rate. dt Without solving the DE explicitly: a) Let r = 0. Find all critical points and classify each according to its stability type using a phase-line diagram. Sketch some representative integral curves. b) What is the smallest value of r such that the population always stabilizes at a size greater than 4, no matter what the size of the initial population? c) Sketch the P vs. r bifurcation diagram. 8B. Frequency Response 8B-1. For each of the following systems, use your calculus graphing skills to plot the graph of the amplitude response (i.e. gain vs. ω). If there is a resonant frequency say what it is. a) x 00 + x 0 + 7x = F0 cos ωt. b) x 00 + 8x 0 + 7x = F0 cos ωt. 8C. Pole Diagrams 8C-1. Consider the following pole diagrams for some linear time invariant systems P( D ) x = f (t). ( a) (b) × × × × × × × × ( g) (h) × × × × × (f) × (e) × (d) (c) × × × × × × a) Which of the systems are stable? b) For which systems are all of the non-zero solutions to the homogeneous equation oscillatory? c) For which systems are none of the non-zero solutions to the homogeneous equation oscillatory? d) For which systems does P( D ) have real coefficients? Section 8: Extra Problems 2 e) Comparing b and c, for which one does the weight function decay faster. (Assume both plots are on the same scale.) f) Give the order of each of the systems. g) Give a possible polynomial P( D ) that would have pole diagram (a). Do the same thing for (b) and (c). h) Comparing (b) and (h) which has the largest possible response to input of the form cos ωt? M.I.T. 18.03 Ordinary Differential Equations 18.03 Notes and Exercises c Jeremy Orloff, Haynes Miller and M.I.T., 2011 1

